I believe that it is possible to beat the market through a consistent and unemotional approach. This is primarily achieved through preparing instead of reacting. Click here to learn more about how I use the indicators below and Click here to get my complete trading strategy! Please be advised that I swing trade and will often hold onto a position for > 1 month. What you do with your $ is your business, what I do with my $ is my business.
My recent Bitcoin Bubble Comparison - 3 Day Chart led to the following calls: < $5,750 by 11/15/2018 & my prediction for the bottom is $2,718 by 1/20/19 | My Bitcoin Bubble Comparison - Monthly Chart closely mirrored my price and time targets | Calling for $35 ETH before the end of 2018.
Previous analysis: “I was expecting a strong bounce yesterday to take us into a resistance cluster at $5,200, mainly due to the bullish marubozu on the 4h followed by the high volume hammer. I am not particularly happy with the price action since then.”
Position: Long spot BTC from $4,225 | Short ETHBTC from 0.03109 | Short LTCBTC from 0.00752 | Short EOS:BTC from 0.0008057
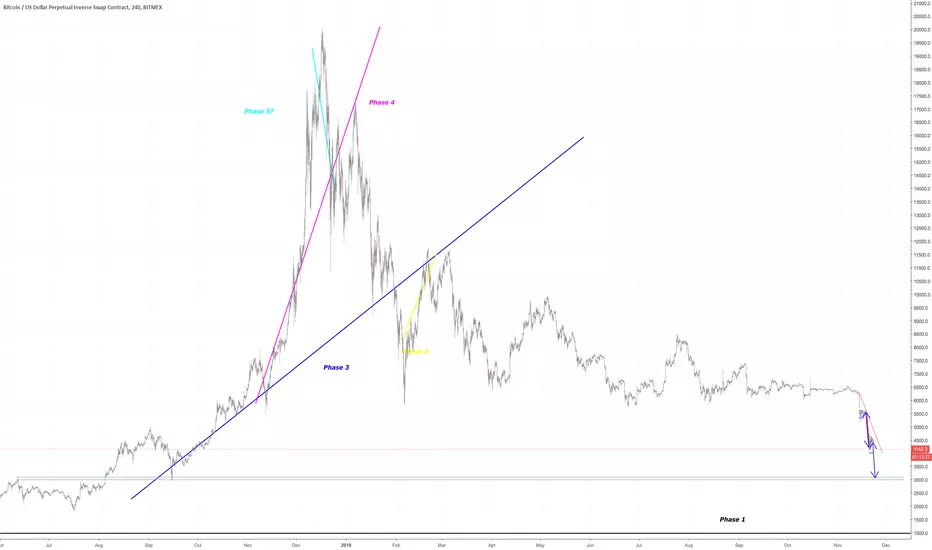
Patterns: Bear pennant $3,101 target
Horizontal support and resistance: Support at $4,200 should turn into resistance | $4,000 is key support
BTCUSDSHORTS: Trending up nicely and still room to go before major resistance
Funding Rates: Shorts pay longs 0.0463%
Short term trend (4 day MA): Closed below, now entire candle is below
Medium term trend (9 day MA): Very surprised that we did not retest 9 MA in the last 24 - 48 hours
Long term trend ( 34 day MA): Turning over
Overall trend: Bear
Volume: The volume is significant on the pennant breakdown
FIB’s: Start at $1,000 and connect to ATH’ and 0.886 = $3,164
Candlestick analysis: 4h looks like 3 black crows to me | Weekly is shaping up to be a marubozu
Ichimoku Cloud: Haven’t even retested 1h cloud
TD’ Sequential: Binance is showing a r2 < r1 after a completed setup. Bitmex is showing a r7 | Weekly r2 < r1
Visible Range: If we breakdown $4,000 then there should be significant support at $3,750. If we breakdown that area then I would expect a fall to $3,100
Price action: 24h: -8.6% | 2w: -34.95% | 1m: -34.95%
Bollinger Bands: Failed to closed inside the daily band, now appears to be getting stuck to the bottom
Trendline: Failed to retest the 8 day MA and also failed to retest 4h trendline. Is capitulation coming?
Daily Trend: Bear
Fractals: Down printed at $4,000. If that breaks, the next down fractal is at $3,559 however I do not expect that to hold due to the gap in the volume profile.
RSI: Since we have not gotten a divergence we can still make another leg down even though we are this oversold.
Stochastic: Recrossed bearish, very bad sign for bulls
Summary: Over the last couple days I have been buying spot BTC’ and longing ETH:USD while also shorting alts against BTC’. I then exited my long at a nominal loss and opened a short at a much worse price. May seem like bad trading but it actually brings up some important topics
that I haven’t talked enough about: position sizing, risk:reward and hedging.
Position Size: There is very big a difference between taking a large position and taking a small position. Each should be done when the circumstance calls for it. For example: great risk:reward and betting with the trend.
Risk:Reward: If retail business is “location, location, location” then I believe trading is risk:reward, risk:reward, risk:reward. If you are able to find positions with a 5:1 ratio, or better, then you don’t have to be right very often to crush any market.
Hedging: I do not do nearly as much of this as I should / could and it is something I intent to get better at. However sometimes there are trades that appear to be profitable by themselves as well as being a form of a hedge.
Do to what is outlined above I have been taking out large shorts on alts and I simply could not pass up buying the horizontal support of BTC’ and ETH’. I even tried signing up for a new exchange to leverage trade LTC:USD.
I was quick to get out after breaking down support and after seeing further action I liked (ETH’ appears to be breaking down horizontal support with a large gap in volume profile, whereas that is not the case for BTC’).
Happy Thanksgiving I love you all!
My recent Bitcoin Bubble Comparison - 3 Day Chart led to the following calls: < $5,750 by 11/15/2018 & my prediction for the bottom is $2,718 by 1/20/19 | My Bitcoin Bubble Comparison - Monthly Chart closely mirrored my price and time targets | Calling for $35 ETH before the end of 2018.
Previous analysis: “I was expecting a strong bounce yesterday to take us into a resistance cluster at $5,200, mainly due to the bullish marubozu on the 4h followed by the high volume hammer. I am not particularly happy with the price action since then.”
Position: Long spot BTC from $4,225 | Short ETHBTC from 0.03109 | Short LTCBTC from 0.00752 | Short EOS:BTC from 0.0008057
Patterns: Bear pennant $3,101 target
Horizontal support and resistance: Support at $4,200 should turn into resistance | $4,000 is key support
BTCUSDSHORTS: Trending up nicely and still room to go before major resistance
Funding Rates: Shorts pay longs 0.0463%
Short term trend (4 day MA): Closed below, now entire candle is below
Medium term trend (9 day MA): Very surprised that we did not retest 9 MA in the last 24 - 48 hours
Long term trend ( 34 day MA): Turning over
Overall trend: Bear
Volume: The volume is significant on the pennant breakdown
FIB’s: Start at $1,000 and connect to ATH’ and 0.886 = $3,164
Candlestick analysis: 4h looks like 3 black crows to me | Weekly is shaping up to be a marubozu
Ichimoku Cloud: Haven’t even retested 1h cloud
TD’ Sequential: Binance is showing a r2 < r1 after a completed setup. Bitmex is showing a r7 | Weekly r2 < r1
Visible Range: If we breakdown $4,000 then there should be significant support at $3,750. If we breakdown that area then I would expect a fall to $3,100
Price action: 24h: -8.6% | 2w: -34.95% | 1m: -34.95%
Bollinger Bands: Failed to closed inside the daily band, now appears to be getting stuck to the bottom
Trendline: Failed to retest the 8 day MA and also failed to retest 4h trendline. Is capitulation coming?
Daily Trend: Bear
Fractals: Down printed at $4,000. If that breaks, the next down fractal is at $3,559 however I do not expect that to hold due to the gap in the volume profile.
RSI: Since we have not gotten a divergence we can still make another leg down even though we are this oversold.
Stochastic: Recrossed bearish, very bad sign for bulls
Summary: Over the last couple days I have been buying spot BTC’ and longing ETH:USD while also shorting alts against BTC’. I then exited my long at a nominal loss and opened a short at a much worse price. May seem like bad trading but it actually brings up some important topics
that I haven’t talked enough about: position sizing, risk:reward and hedging.
Position Size: There is very big a difference between taking a large position and taking a small position. Each should be done when the circumstance calls for it. For example: great risk:reward and betting with the trend.
Risk:Reward: If retail business is “location, location, location” then I believe trading is risk:reward, risk:reward, risk:reward. If you are able to find positions with a 5:1 ratio, or better, then you don’t have to be right very often to crush any market.
Hedging: I do not do nearly as much of this as I should / could and it is something I intent to get better at. However sometimes there are trades that appear to be profitable by themselves as well as being a form of a hedge.
Do to what is outlined above I have been taking out large shorts on alts and I simply could not pass up buying the horizontal support of BTC’ and ETH’. I even tried signing up for a new exchange to leverage trade LTC:USD.
I was quick to get out after breaking down support and after seeing further action I liked (ETH’ appears to be breaking down horizontal support with a large gap in volume profile, whereas that is not the case for BTC’).
Happy Thanksgiving I love you all!
Nota
This is starting to wreak of a fake breakdown. I am setting my stop loss at $126 and watching closely to see where we close. I have only entered a small position, and was planning on a medium - large. Now I feel much differently.
When markets move fast you have to be able to move fast as well as long as that is what your trading strategy calls for. Personally I am very comfortable taking paper-cut wounds when it appears highly likely that a big move is coming.
emasar Indicator is available for purchase at alphanalysis.io/product/emasar/
Penafian
Maklumat dan penerbitan adalah tidak dimaksudkan untuk menjadi, dan tidak membentuk, nasihat untuk kewangan, pelaburan, perdagangan dan jenis-jenis lain atau cadangan yang dibekalkan atau disahkan oleh TradingView. Baca dengan lebih lanjut di Terma Penggunaan.