ETF but can still ARC
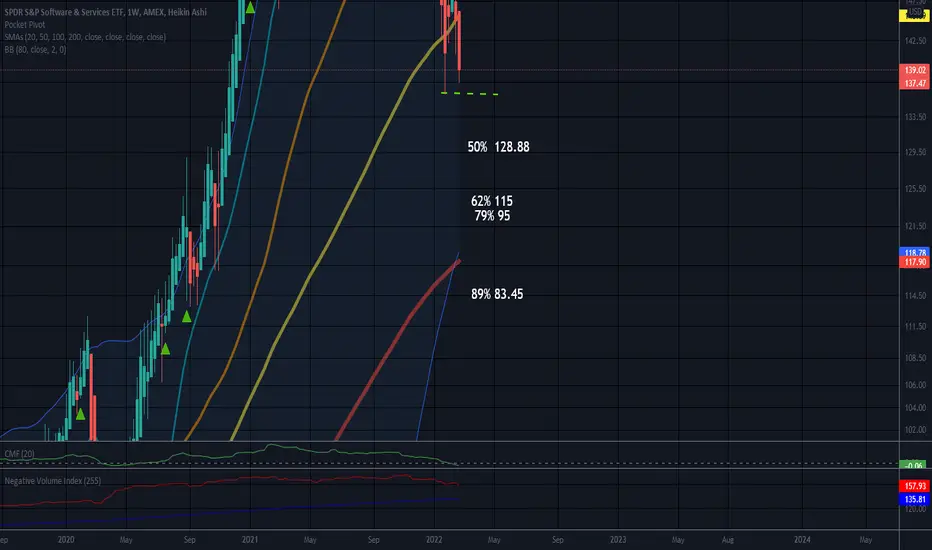
Most Arcs land between to 79% and 62% mark.
Some fall less, some fall more.
This is a weekly chart. ARCs are easier to see on monthly and weekly charts.
Too much green can cause a lot of red on the way down. Unfortunately, nothing goes up forever. A steep green rise is often unsustainable.
Trying to trade an arc of the way down is not an easy task as it will be volatile as a rule. I would think an ETF may be a smidgeon easier to trade than an ARC security though. But this is one of the few ETF ARCs I have seen.
No recommendation
Penafian
Maklumat dan penerbitan adalah tidak dimaksudkan untuk menjadi, dan tidak membentuk, nasihat untuk kewangan, pelaburan, perdagangan dan jenis-jenis lain atau cadangan yang dibekalkan atau disahkan oleh TradingView. Baca dengan lebih lanjut di Terma Penggunaan.
Penafian
Maklumat dan penerbitan adalah tidak dimaksudkan untuk menjadi, dan tidak membentuk, nasihat untuk kewangan, pelaburan, perdagangan dan jenis-jenis lain atau cadangan yang dibekalkan atau disahkan oleh TradingView. Baca dengan lebih lanjut di Terma Penggunaan.