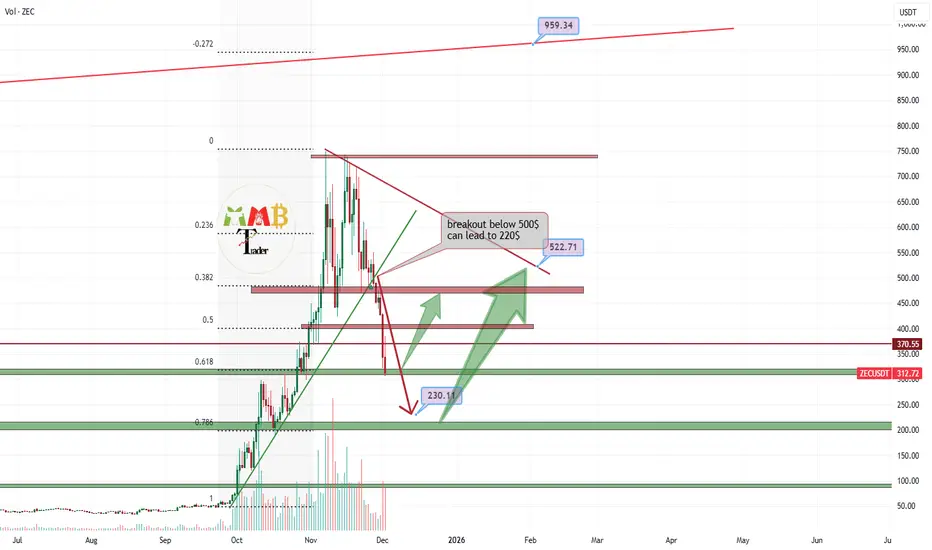
On the ZECUSDT chart, we have observed a decisive breakdown below the key $500 support level, resulting in a decline toward the $300 zone. This level now represents a critical technical confluence, aligning with both a historically significant support area and the 0.618 Fibonacci retracement level.
Given the oversold conditions and the strength of this Fibonacci-support confluence, a technical rebound toward the $500 level—now likely to act as resistance—is plausible. Such a move would be characteristic of a retest of the broken support level, which, if rejected, could result in a continuation of the downtrend. Should the $300 support fail to hold, the next significant structural support would become the primary focus.
DISCLAIMER: ((trade based on your own decision))
<<press like👍 if you enjoy💚
Get Up to $30,000 with deposit & trading at BYBIT+$100 welcome bonus= only with my link now: shorturl.at/JgGFD
My telegram channel: t.me/mmbtchannel
VIP Channels:
Crypto +390% & Forex:+600Pips monthly.
check my telegram for more.
My telegram channel: t.me/mmbtchannel
VIP Channels:
Crypto +390% & Forex:+600Pips monthly.
check my telegram for more.
Penafian
Maklumat dan penerbitan adalah tidak bertujuan, dan tidak membentuk, nasihat atau cadangan kewangan, pelaburan, dagangan atau jenis lain yang diberikan atau disahkan oleh TradingView. Baca lebih dalam Terma Penggunaan.