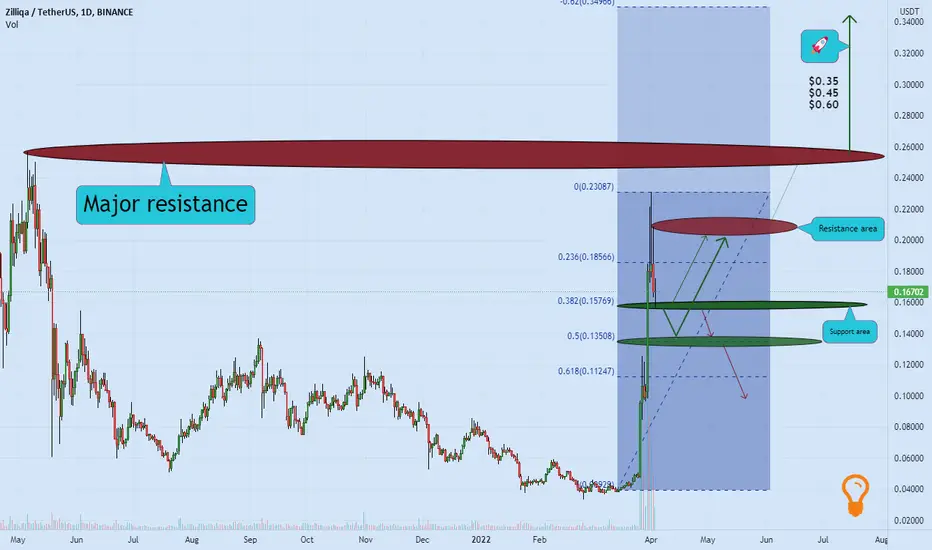
Based on the chart after long time, we can see appropriate amount of volume for the price and sharp candlesticks ✔️
if
this volume continues, and the price stays above the support area, we will see more gain 🚀
before
more gain, we can see brief correction to the downside (close to our Fibonacci levels support zone)
if
the price breaks the support area here to the downside, we will see more correction ❌🧨
Please, feel free to ask your question, write it in the comments below, and I will answer.🐋
if
this volume continues, and the price stays above the support area, we will see more gain 🚀
before
more gain, we can see brief correction to the downside (close to our Fibonacci levels support zone)
if
the price breaks the support area here to the downside, we will see more correction ❌🧨
Please, feel free to ask your question, write it in the comments below, and I will answer.🐋
Educational plans & Free signals, all in telegram:👉t.me/madwhalechannel
Hey buddy, If you’re up for it, would love if you signed up on this exchange with my link. I get a tiny cut no ads, no pressure, just a little love: 👇bit.ly/4jp4yMI
Hey buddy, If you’re up for it, would love if you signed up on this exchange with my link. I get a tiny cut no ads, no pressure, just a little love: 👇bit.ly/4jp4yMI
Penerbitan berkaitan
Penafian
Maklumat dan penerbitan adalah tidak dimaksudkan untuk menjadi, dan tidak membentuk, nasihat untuk kewangan, pelaburan, perdagangan dan jenis-jenis lain atau cadangan yang dibekalkan atau disahkan oleh TradingView. Baca dengan lebih lanjut di Terma Penggunaan.