Today's NFP print was an astronomical miss (3 sigma), which is just another reminder that economic models/risk models are breaking across the board as they can no longer explain reality.
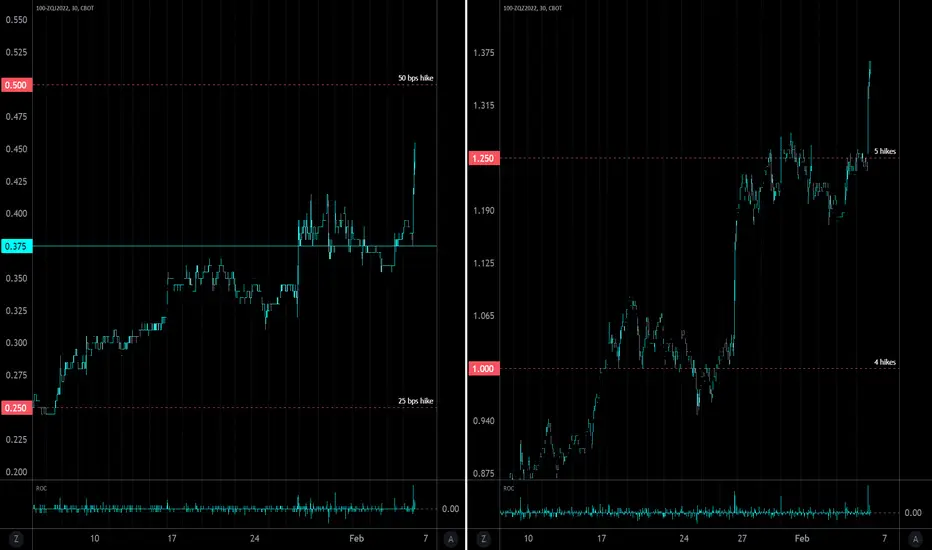
Everybody seems confused about how to interpret what is going on in the labor market, but the main takeaway, as expressed through above charts is, that the Fed will hike even faster than previously anticipated.
Once again market's have failed to price in the reality on the ground and the hill markets have to climb over the coming months (especially the growth complex) is only getting steeper. Prepare accordingly.
Explainer: Both charts are mapping the expected future federal funds rate. Left is April, right is December.
Penafian
Maklumat dan penerbitan adalah tidak bertujuan, dan tidak membentuk, nasihat atau cadangan kewangan, pelaburan, dagangan atau jenis lain yang diberikan atau disahkan oleh TradingView. Baca lebih dalam Terma Penggunaan.
Penafian
Maklumat dan penerbitan adalah tidak bertujuan, dan tidak membentuk, nasihat atau cadangan kewangan, pelaburan, dagangan atau jenis lain yang diberikan atau disahkan oleh TradingView. Baca lebih dalam Terma Penggunaan.