How Low Can Bitcoin Go in September 2025? BTC Price Predictions & Analysis
The question "How low can Bitcoin go in September 2025?" has taken on urgent relevance as the cryptocurrency enters its historically weakest month trading today, Monday, 1 September 2025, at $108,253, down 0.49% from yesterday and marking a concerning 6.5% August decline.
Why is Bitcoin going down as September begins reflects both seasonal patterns and technical breakdowns that suggest further weakness ahead. However, my technical analysis suggests that the declines will be limited, and expert Bitcoin price predictions for the short and medium term indicate a relatively quick rebound toward all-time highs (ATH).
Bitcoin September 2025: Current Price Action
Bitcoin (BTC) begins September at a critical juncture, having broken its four-month winning streak with August's 6.5% decline while US-listed spot ETFs hemorrhaged $751 million in outflows. The cryptocurrency now trades near $108,000, approximately 13% below its August all-time high of $124,533.
Key Bitcoin metrics for September 1, 2025:
- Currentprice: $108,253
- Monthly start: Down 0.49% from August31
- August performance: -6.5% (first red monthsince April)
- ETFoutflows: $751 million in August
- Whale addresses (100+ BTC): Record high 19,130
The price action reflects growing concern about Bitcoin's ability to maintain support levels as the month progresses.
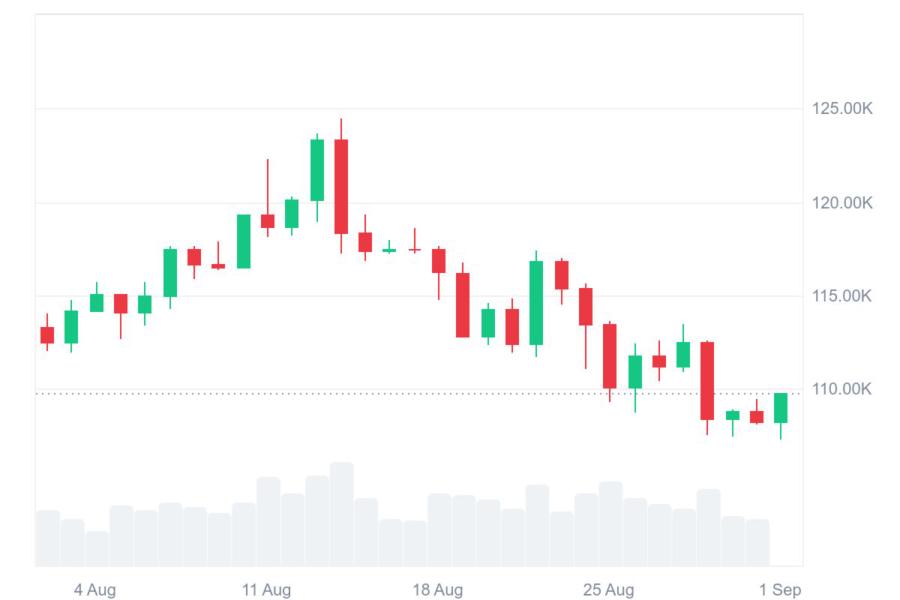
Bitcoin price today. Source: CoinMarketCap.
Red September: Historical Patterns Spell Trouble
September's Brutal Track Record
Bitcoin price predictions September 2025 must account for the month's devastating historical performance. Since 2013, Bitcoin has posted average returns of -3.77% in September, closing red in 8 of the past 12 years. This "Red September" phenomenon mirrors broader market patterns, with the S&P 500 averaging -1.20% returns in September since 1928.
Yuri Berg from FinchTrade explains the mechanics: "Many investment funds close their fiscal year in September, divesting losing positions for tax reasons, and rebalancing their portfolios". The structural selling pressure creates a self-reinforcing downward spiral as traders anticipate weakness.
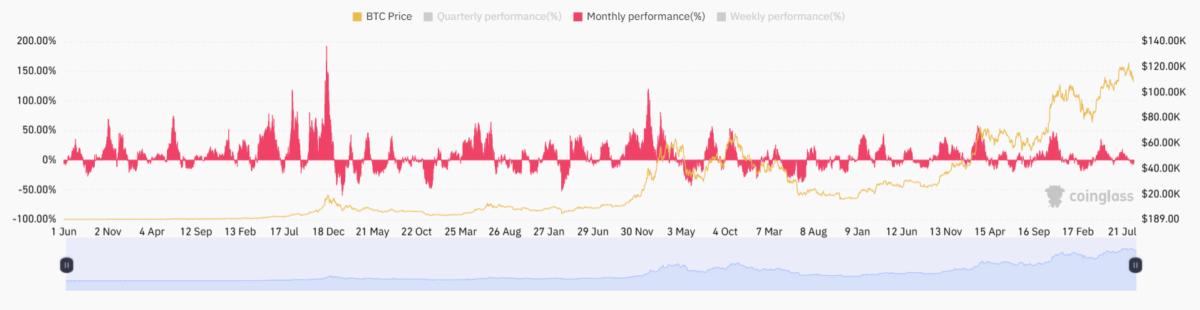
September is the one of the worst months for Bitcoin price action. Source: CoinGlass
2025 Mirrors 2017 Pattern
However, analyst Rekt Fencer argues "a September dump is not coming" this year, citing similarities to 2017 when Bitcoin found support after August weakness before "rocketing to $20,000". The chart overlay reveals Bitcoin hovering near the crucial $105,000-$110,000 base that previously acted as resistance before flipping to support.
Rekt Fencer@rektfencerOgos 30, 2025SEPTEMBER DUMP IS NOT COMING$BTC already front-ran the sell-off.
It played out the same way in 2017
Bears will miss the pump again pic.twitter.com/XIhKmpUlT1
Technical Analysis: How Low Can Bitcoin Drop?
Key Support Levels Under Siege
Based on my comprehensive technical analysis, Friday's nearly 4% decline broke Bitcoin out of its two-month consolidation that had kept prices near historical maximums. The cryptocurrency has now broken through legal support around $107,500, which coincides with the lowest levels in nearly two months.
The critical support zone begins at $104,000, precisely at the 200-day moving average (200 MA). This support extends down to the psychological $100,000 level, where significant buy orders have accumulated. This zone is further reinforced by the 50% Fibonacci retracement measured from the April uptrend to August's historical maximum near $125,000.
If asked how low Bitcoin can fall in September 2025, from current levels it would be maximum 8% decline to exactly $100,000, in my opnions. The analysis doesn't anticipate a stronger correction, and all downward movements will be treated as reaccumulation opportunities and buying chances at more attractive prices.
Despite the bearish setup, "hidden bullish divergence" appears on Bitcoin's RSI, suggesting "the market is not as weak as the price chart suggests". Analyst ZYN projects Bitcoin could reach "a fresh all-time high above $124,500 within the next 4–6 weeks" based on these technical patterns.
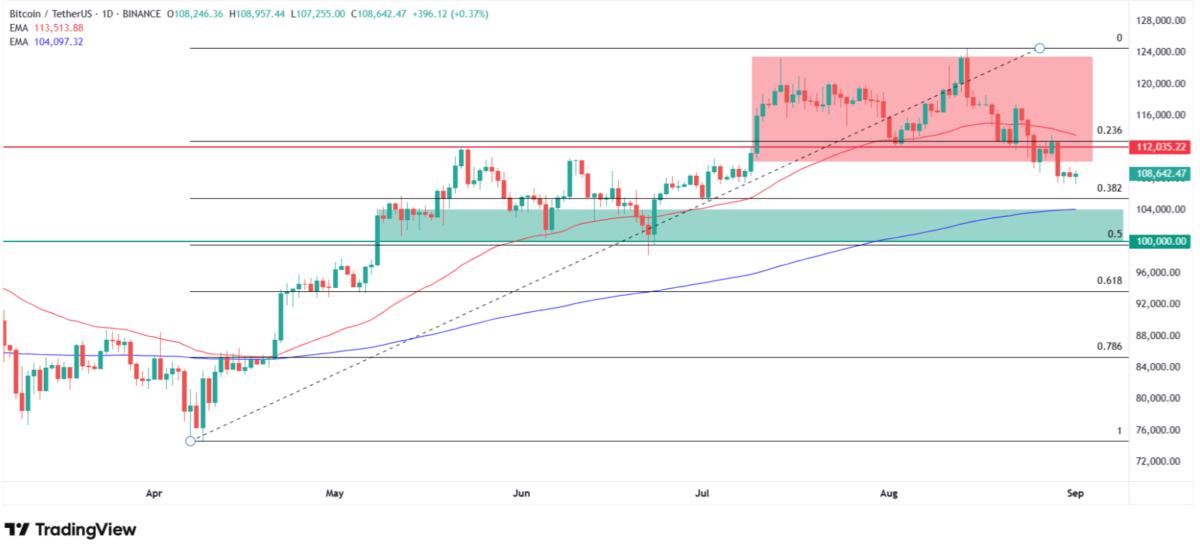
How low can Bitcoin go? Technical analysis. Source: Tradingview.com
Institutional Dynamics: Mixed Signals
- Record Whale Accumulation Despite Weakness - A remarkable development shows whale addresses holding 100+ BTC reached a record high of 19,130, surpassing even the 2017 peak. This accumulation pattern suggests sophisticated investors are buying the dip despite retail capitulation.
- ETF Outflows Signal Institutional Caution - Conversely, $751 million in ETF outflows during August indicates institutional uncertainty. The divergence between whale accumulation and ETF selling suggests different time horizons and risk appetites among large holders.
- Fed Policy Creates Macro Tailwind - Currency traders are turning bearish on the dollar with expectations for Fed rate cuts creating potential upside catalysts. The 52-week correlation between Bitcoin and the Dollar Index has weakened to -0.25, its lowest level in two years, suggesting Bitcoin could benefit from dollar weakness.
September 2025 Bitcoin Price Predictions: Expert Consensus
Bearish Scenarios Dominate
Changelly's Bitcoin price predictions September 2025 show potential volatility with a minimum target of $108,802 and maximum of $124,283. However, most technical analysts lean bearish given the seasonal headwinds and broken support levels.
Binance's forecast projects September ending around $108,332, suggesting limited upside potential.
Bull Case: Breaking the Pattern
Despite historical weakness, some analysts believe Bitcoin could "break the Red September curse" in 2025. Tom Lee, co-founder of Fundstrat Global Advisors, has been one of the most bullish and accurate Bitcoin analysts in recent years. He believes that Bitcoin can go back to $120,000 this month and end the year around $200,00.
The bull case relies on:
- Federal Reserve rate cuts providingliquidity
- Institutional adoption continuingdespite ETF outflows
- Technicalrebound from oversold conditions
- 2017 pattern repetition suggestingfinal shakeout before rally
Ash Crypto predicts "the Fed will start the money printers in Q4" with "two rate cuts mean trillions will flow into the crypto market".
You may also like: New BTC Price Predictions Point to $200K in 2025 and $1M Long Term
Why is Bitcoin Going Down: Fundamental Drivers
Structural September Selling
The September Effect stems from multiple converging factors:
- Portfoliorebalancing by institutional investors
- Tax loss harvesting beforefiscal year-end
- Reducedsummer liquidity creating volatility
- Psychological selling basedon historical patterns
Technical Momentum Breakdown
Key momentum indicators have turned decisively bearish:
- MACDhistogram dropped below zero
- RSI shows oversoldconditions below 30
- Movingaverage structure confirms downtrend
FAQ: Bitcoin September 2025 Outlook
How low can Bitcoin realistically go in September 2025?
My technical analysis suggests $100K-$101K as primary support, though some projections see potential for deeper correction to mid-$90Ks.
Will Bitcoin break the Red September pattern in 2025?
Mixed signals, whale accumulation and Fed policy support bulls, while technical breakdowns and ETF outflows favor bears.
What would trigger a September rally instead of decline?
Federal Reserve dovishness, dollar weakness, and institutional re-entry above $113.5K resistance could flip sentiment.
Is September selling just a self-fulfilling prophecy?
Partly, but structural factors like portfolio rebalancing and reduced liquidity create genuine seasonal headwinds.