ChartWatch ASX Scans: Elixir Energy, Hyterra, Intelligent Monitoring, Lynas Rare Earths, Pro Medicus, Data#3, Red 5
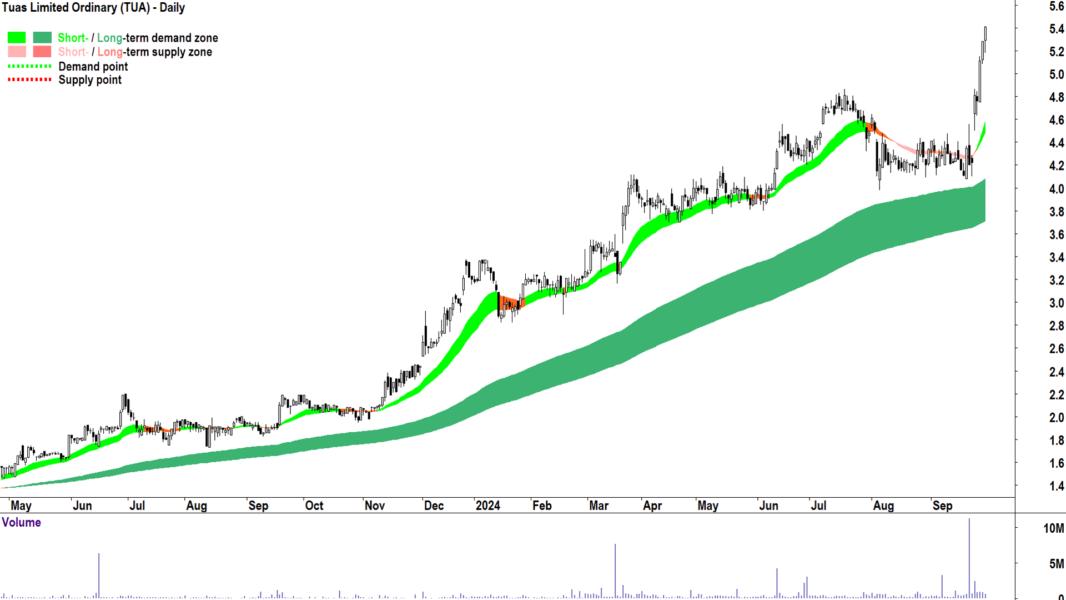
- Interesting uptrends in today's Scans: Brambles (BXB), Elixir Energy (EXR), Goodman (GMG), Hyterra (HYT), Intelligent Monitoring (IMB), Lynas Rare Earths (LYC), Nick Scali (NCK), Nuix (NXL), Pro Medicus (PME), Regal Investment Fund (RF1), Tuas (TUA).
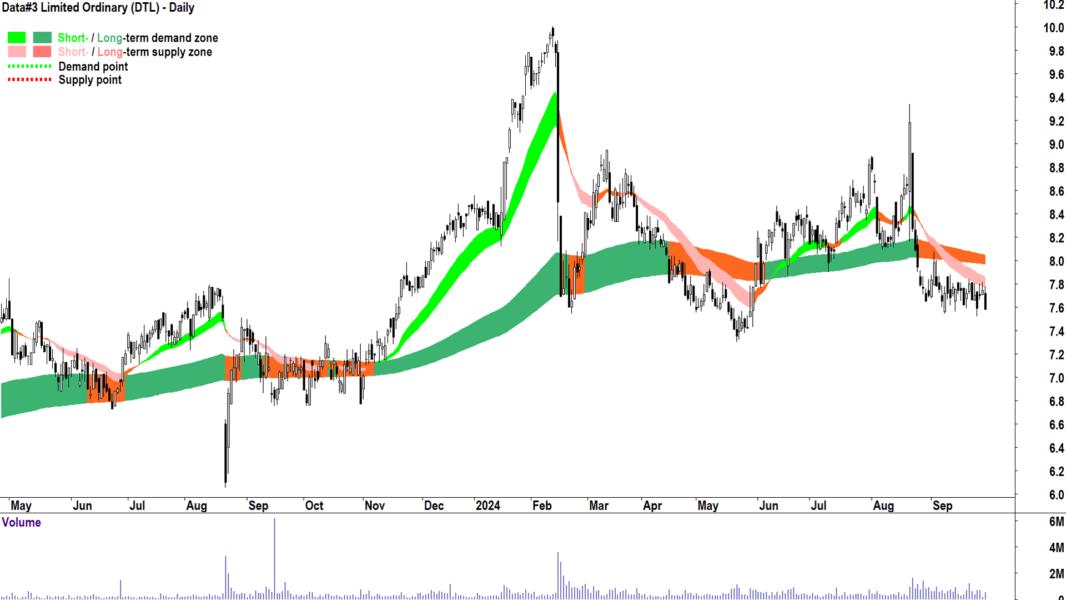
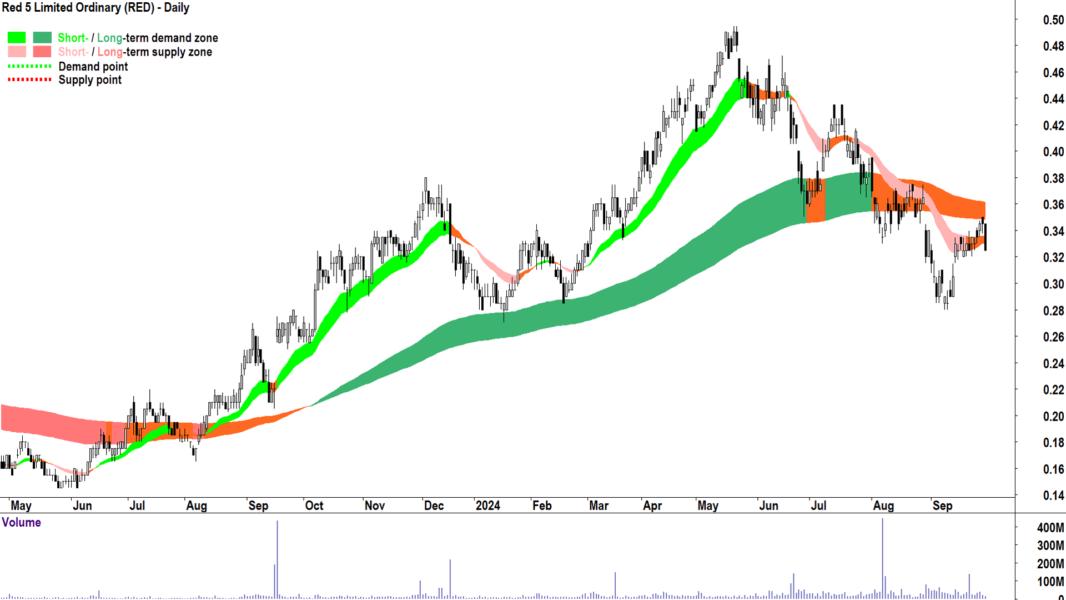
- Interesting downtrends in today's Scans: Data#3 (DTL), Red 5 (RED).
Welcome to my ChartWatch Daily ASX Scans series. Here I present scan lists based on my trend following technical analysis methodology. My goal is to alert you to the best uptrends and downtrends on the ASX.
Uptrends Scan List
Company | Code | Last Price | 1mo % | 1yr % |
Australian Clinical Labs | ACL | $3.67 | +22.3% | +29.2% |
AI-Media Technologies | AIM | $0.755 | +37.3% | +160.3% |
BetaShares S&P/ASX Australian Technology ETF | ATEC | $26.94 | +3.3% | +39.8% |
Accent Group | AX1 | $2.38 | +12.8% | +22.1% |
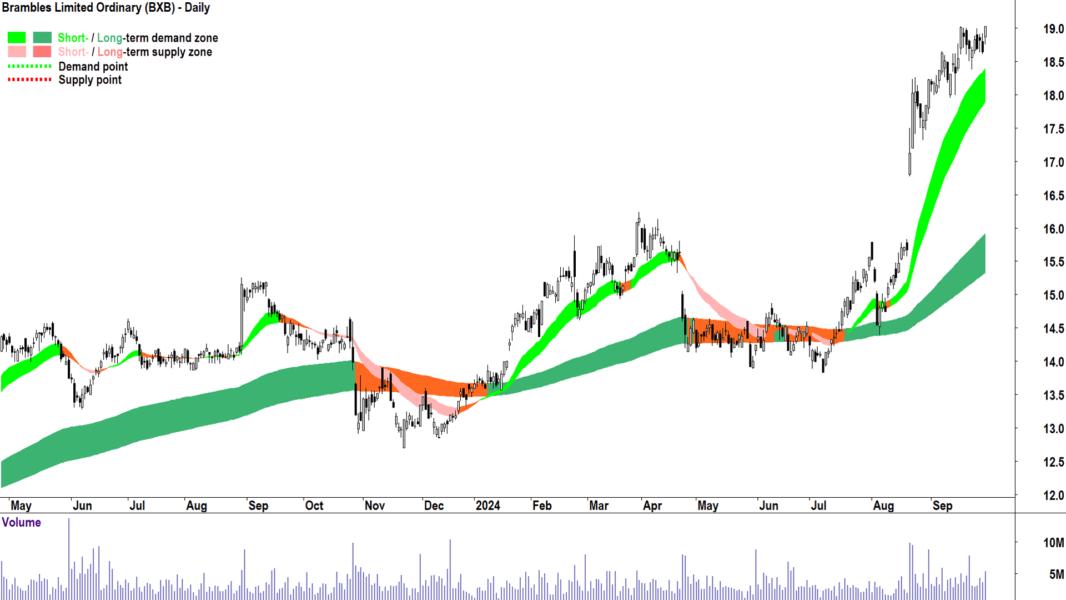
Brambles | BXB | $19.03 | +4.4% | +32.4% |
De Grey Mining | DEG | $1.390 | +13.9% | +14.2% |
Droneshield | DRO | $1.365 | +3.0% | +387.5% |
Dexus Convenience Retail Reit | DXC | $3.04 | +8.6% | +27.7% |
Envirosuite | EVS | $0.079 | +75.6% | +31.7% |
Elixir Energy | EXR | $0.175 | +6.1% | +182.3% |
Future Generation Australia | FGX | $1.270 | +2.2% | +10.4% |
G8 Education | GEM | $1.415 | +11.0% | +36.1% |
Goodman Group | GMG | $36.99 | +10.7% | +71.2% |
Graincorp | GNC | $9.20 | +5.0% | +33.0% |
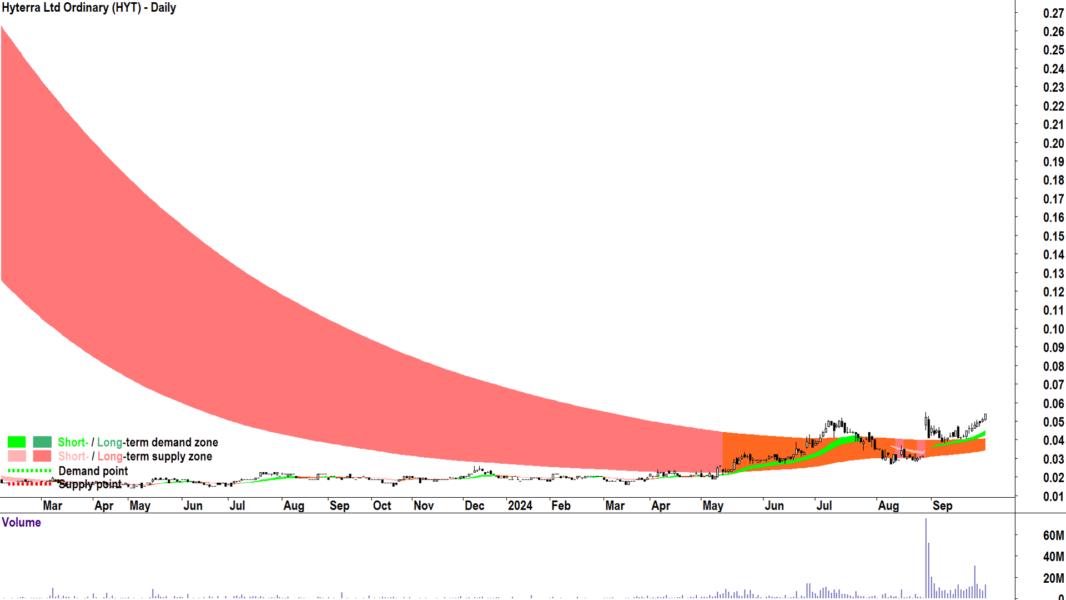
Hyterra | HYT | $0.054 | +31.7% | +175.6% |
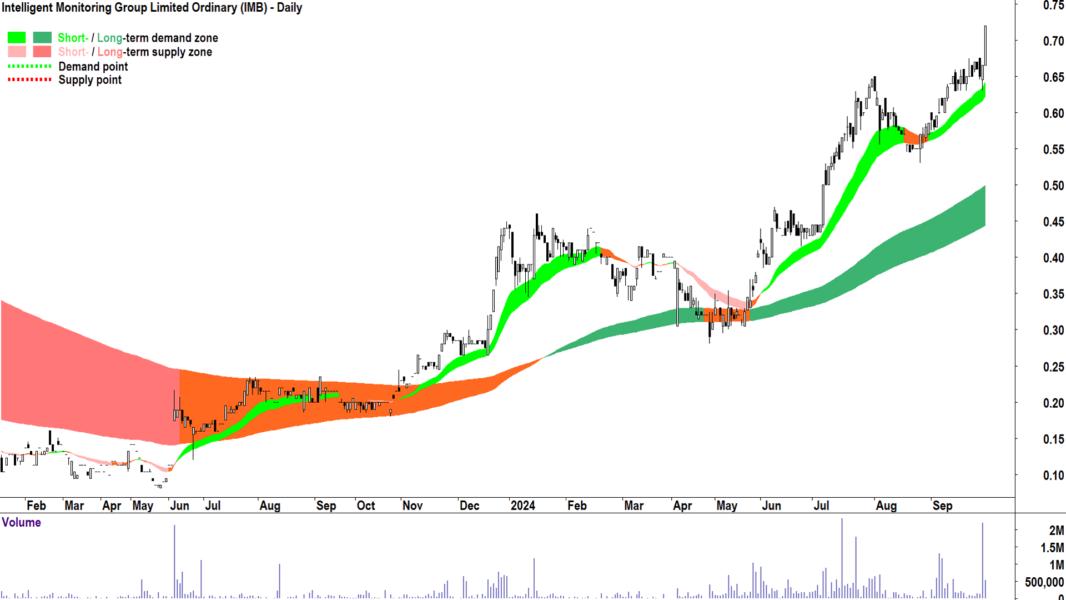
Intelligent Monitoring Group | IMB | $0.720 | +23.1% | +242.9% |
iShares China Large-Cap ETF | IZZ | $48.39 | +21.8% | +16.6% |
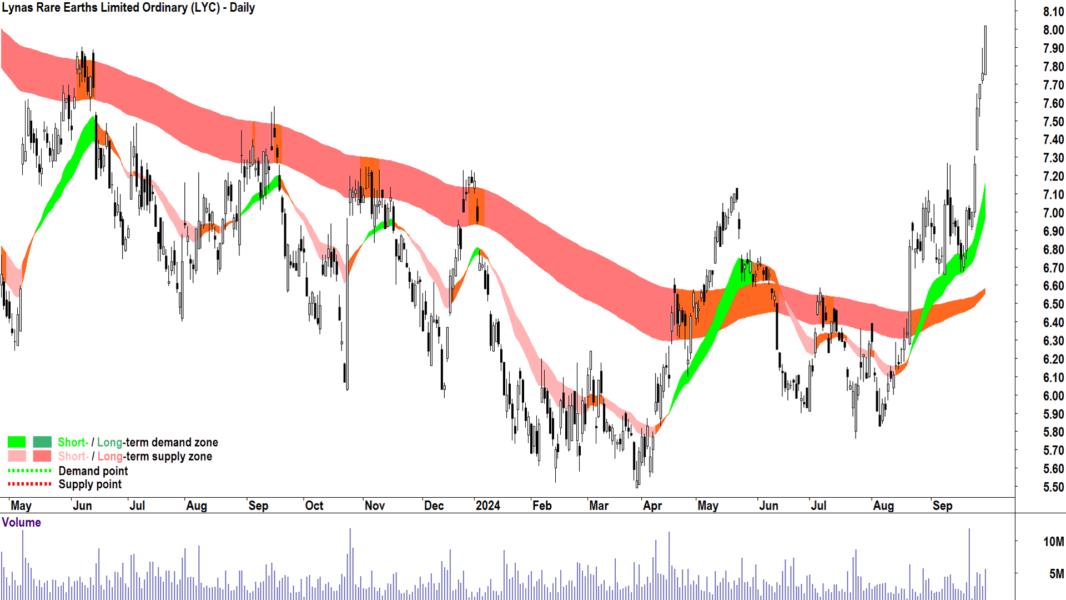
Lynas Rare Earths | LYC | $8.02 | +13.6% | +20.1% |
Metals Acquisition | MAC | $20.78 | +19.6% | 0% |
Mirrabooka Investments | MIR | $3.40 | +0.6% | +16.5% |
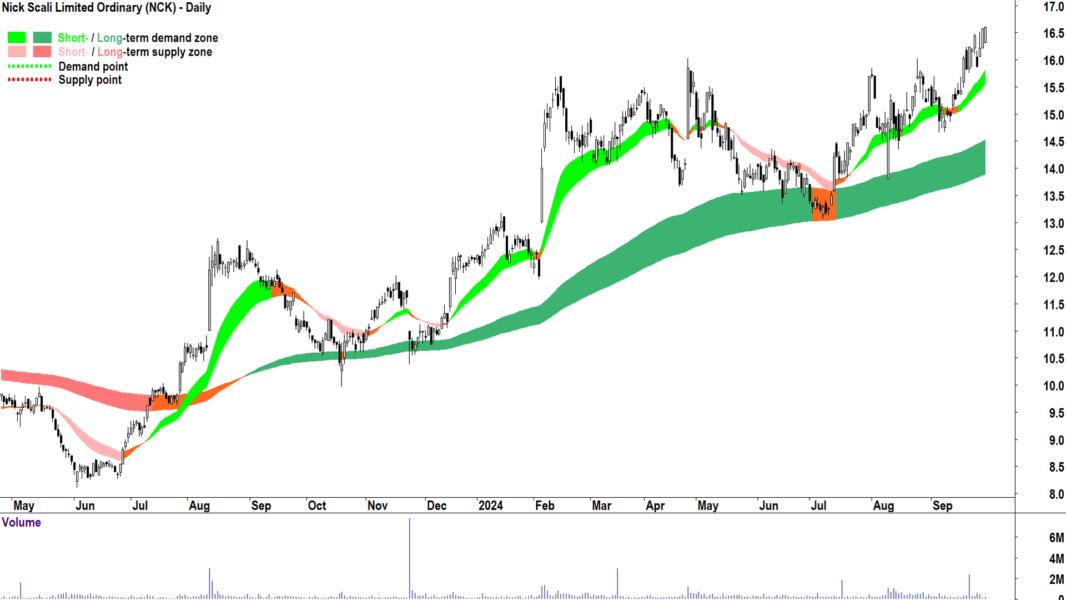
Nick Scali | NCK | $16.60 | +7.5% | +49.6% |
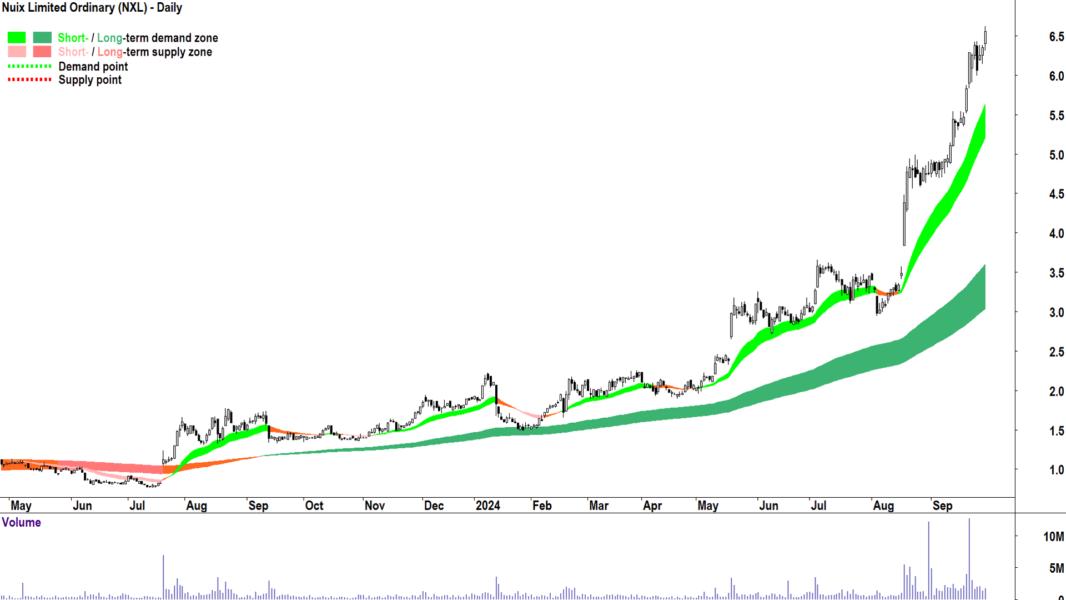
Nuix | NXL | $6.56 | +37.8% | +362.0% |
Orora | ORA | $2.73 | +9.2% | +2.6% |
Platinum Asia Fund ETF | PAXX | $4.88 | +13.2% | +17.6% |
Pro Medicus | PME | $178.25 | +18.3% | +121.0% |
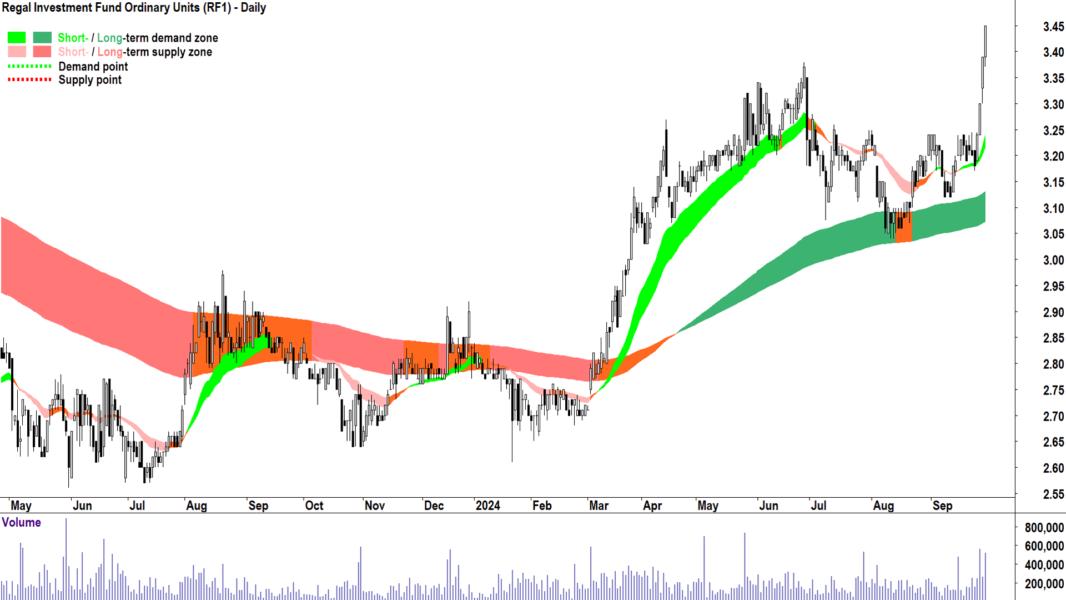
Regal Investment Fund | RF1 | $3.45 | +6.5% | +23.2% |
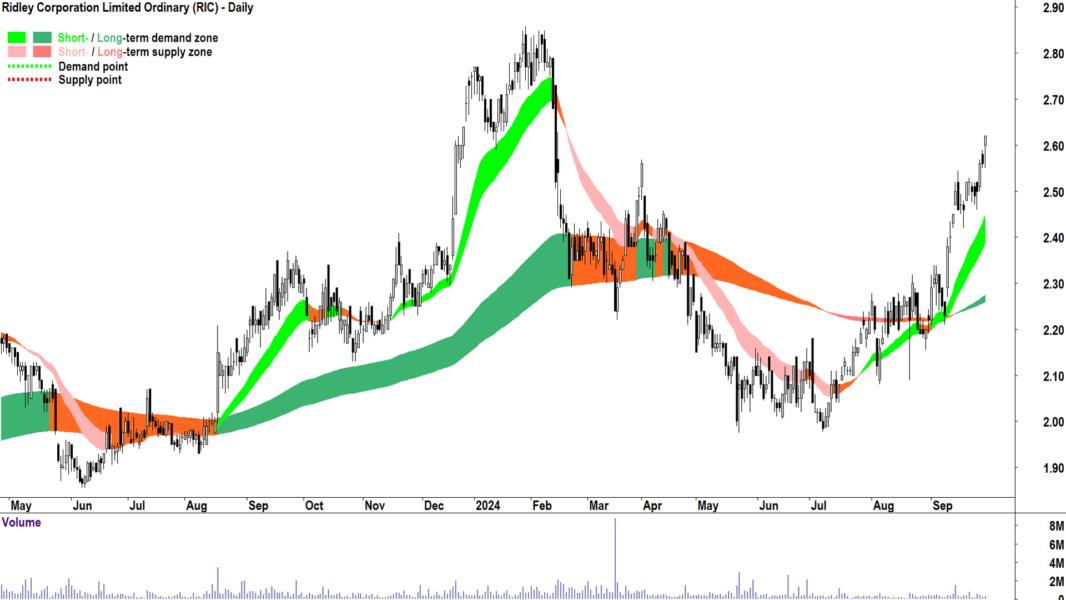
Ridley Corporation | RIC | $2.62 | +18.0% | +11.5% |
Siteminder | SDR | $6.32 | +29.0% | +38.3% |
SKS Technologies Group | SKS | $1.540 | +6.9% | +755.6% |
Servcorp | SRV | $5.15 | +6.6% | +67.2% |
Super Retail Group | SUL | $18.17 | +4.6% | +55.9% |
Temple & Webster Group | TPW | $13.27 | +13.9% | +117.9% |
Tuas | TUA | $5.41 | +24.7% | +154.0% |
Xero | XRO | $149.44 | +4.6% | +32.8% |
Today's Uptrends Scan List
Feature charts from today's Uptrends List 🔎📈
BetaShares S&P/ASX Australian Technology ETF ATEC, Brambles
BXB, Dexus Convenience Retail Reit
DXC, Elixir Energy
EXR, Goodman Group
GMG, Hyterra
HYT, Intelligent Monitoring Group
IMB, iShares China Large-Cap ETF
IZZ, Lynas Rare Earths
LYC, Nick Scali
NCK, Nuix
NXL, Pro Medicus
PME, Regal Investment Fund
RF1, Ridley Corporation
RIC, Servcorp
SRV, Tuas
TUA.
Charts of each below:






Downtrends Scan List
Company | Code | Last Price | 1mo % | 1yr % |
Auckland International Airport | AIA | $6.80 | -0.9% | -4.8% |
Data#3 | DTL | $7.58 | -1.6% | +6.9% |
Red 5 | RED | $0.325 | -4.4% | +18.2% |
Rural Funds Group | RFF | $1.985 | -3.2% | +7.3% |
Spark New Zealand | SPK | $2.82 | -15.3% | -36.9% |
Today's Downtrends Scan List
Feature charts from today's Downtrends List 🔎📉
The stocks that I feel are showing the strongest excess supply from today's Downtrends List are: Data#3 DTL, Red 5 (ASX: RED).
Charts of each below:
ChartWatch Primer
For a detailed explanation of Carl's technical analysis methodology, be sure to check out this ChartWatch Primer.
Important considerations when using the ChartWatch Daily ASX Scans:
1. The future is unknown. Anything can happen to change the trends in the lists above. A stock in a perfect uptrend or downtrend may not remain that way by the close of trading today. 2. These lists are not exhaustive, they are curated by Carl. You will find that certain stocks might not appear in a particular list on consecutive days but might reappear when Carl feels it deserves to return to the list. 3. This is not a recommendation service, merely an aid to help you better understand the workings of Carl’s technical analysis model in a practical way. Carl will not alert you to stocks that have dropped off a list because their trend has changed – it is up to you to apply the criteria to determine why a particular stock might not still be included. 4. This is general, educational information only – always do your own research.