ChartWatch ASX Scans: Metro Mining, Origin Energy, Stanmore Resources, Audinate, Charter Hall, Ebos
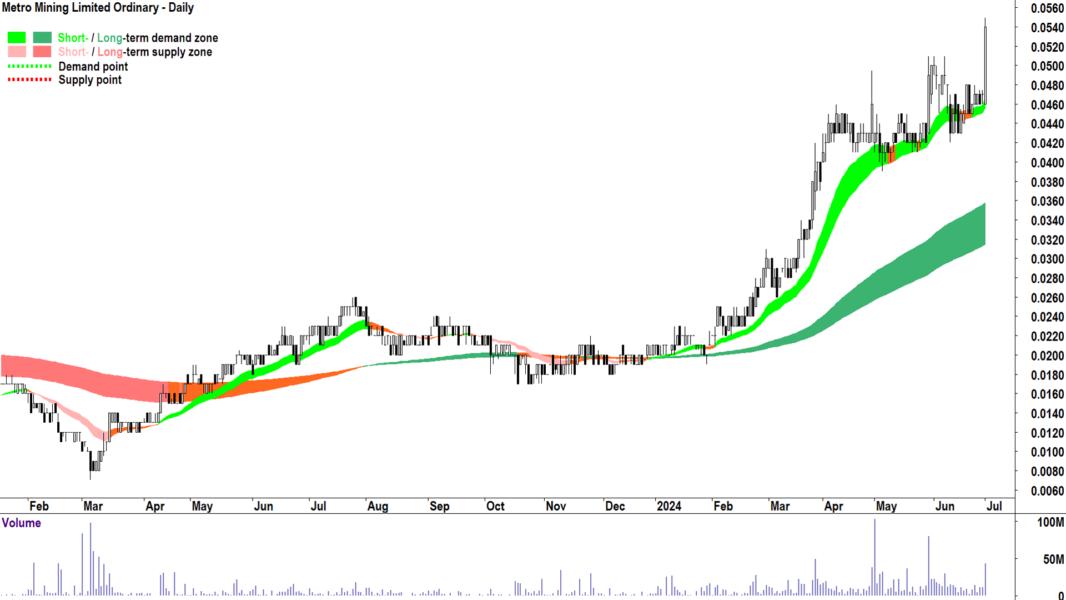
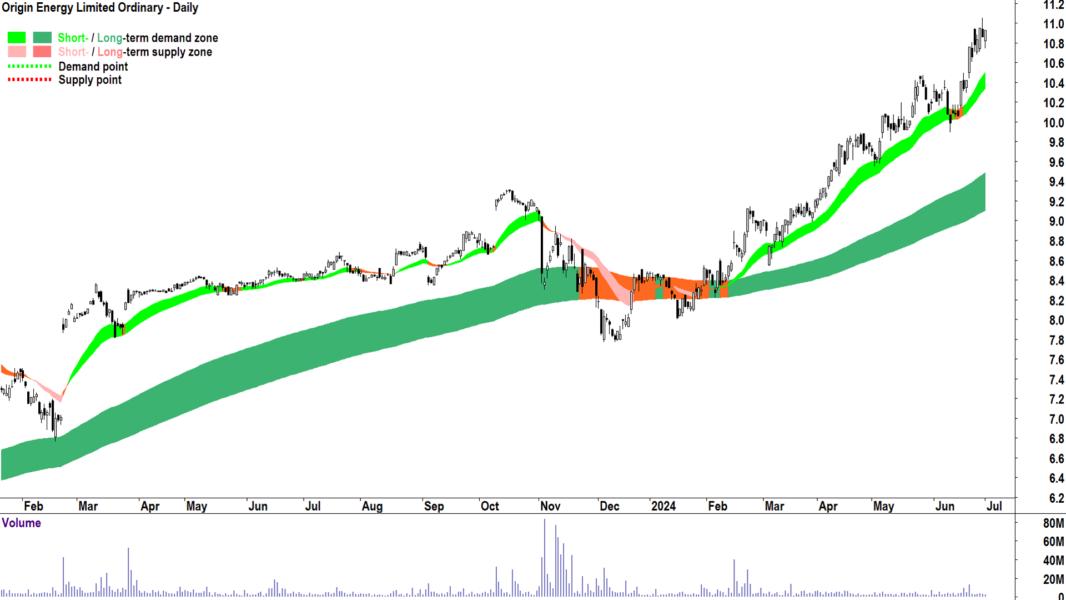
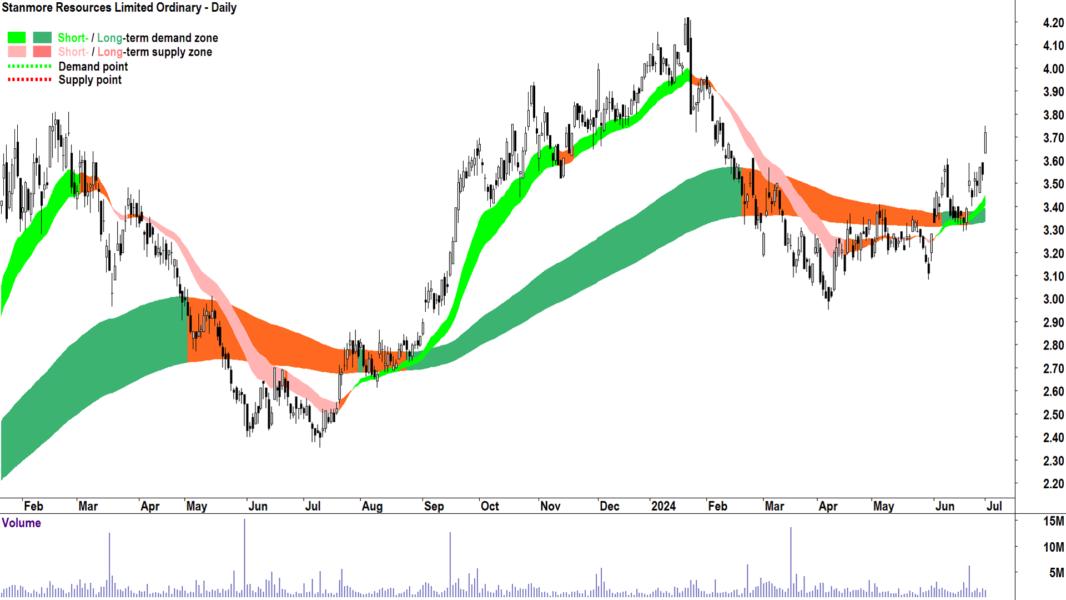
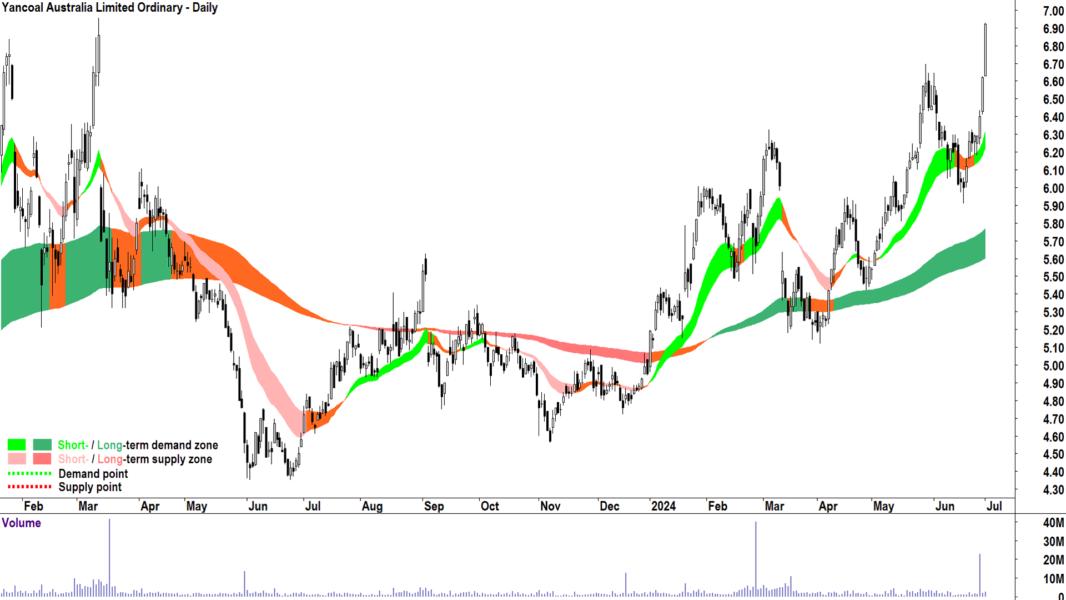
- Interesting uptrends in today's Scan Lists: Metro Mining (MMI), Origin Energy (ORG), Stanmore Resources (SMR), and Yancoal Australia (YAL)
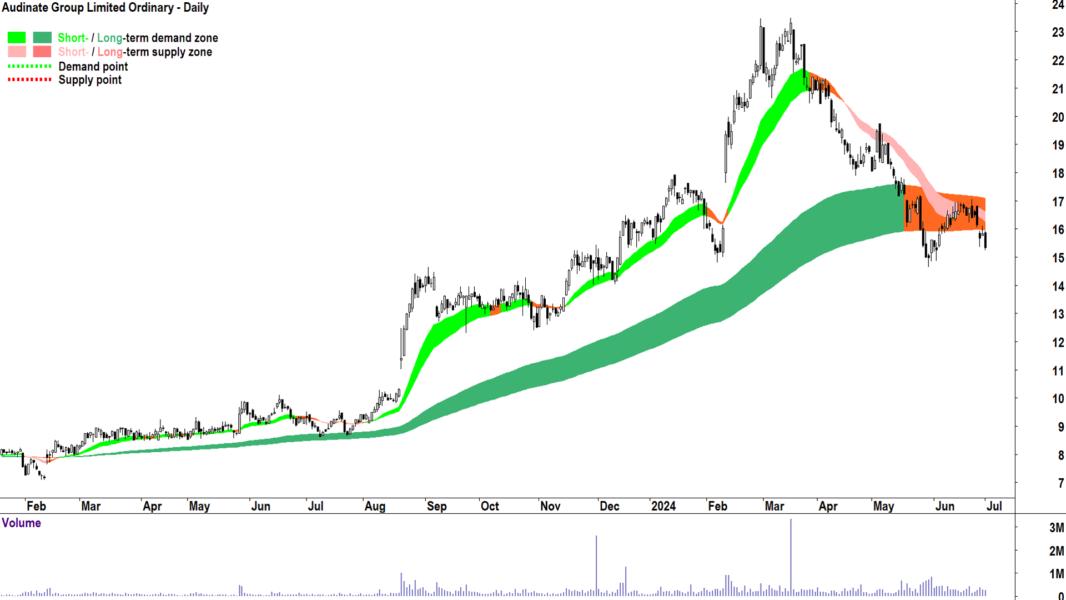
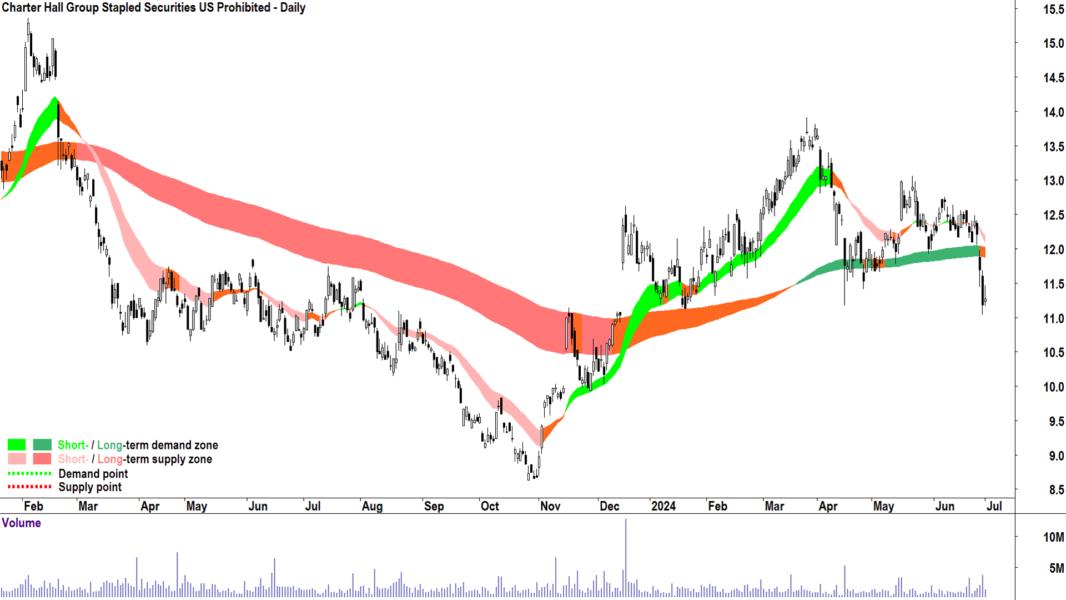
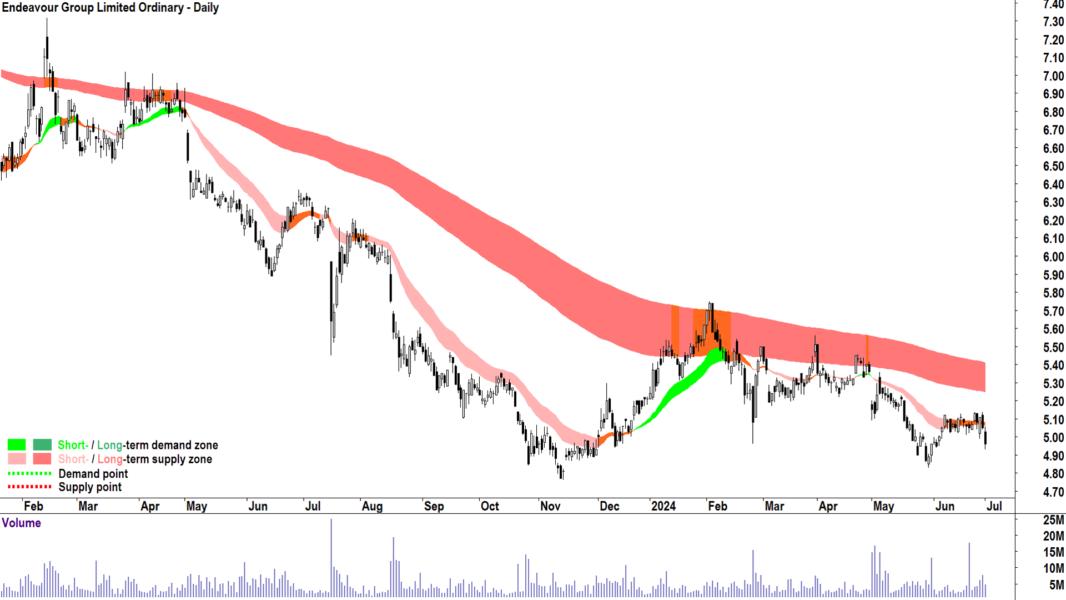
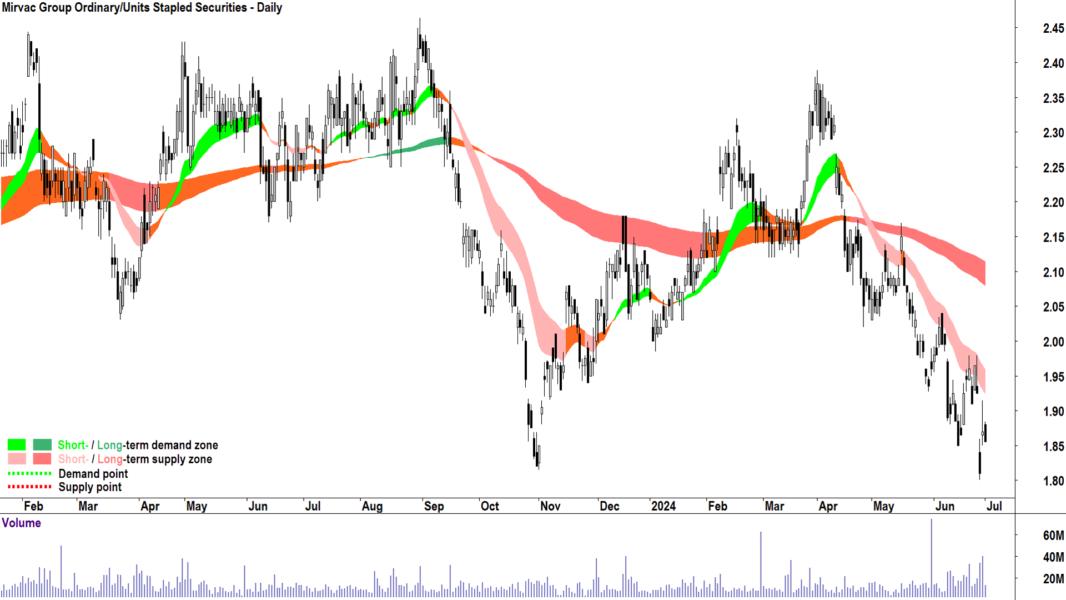
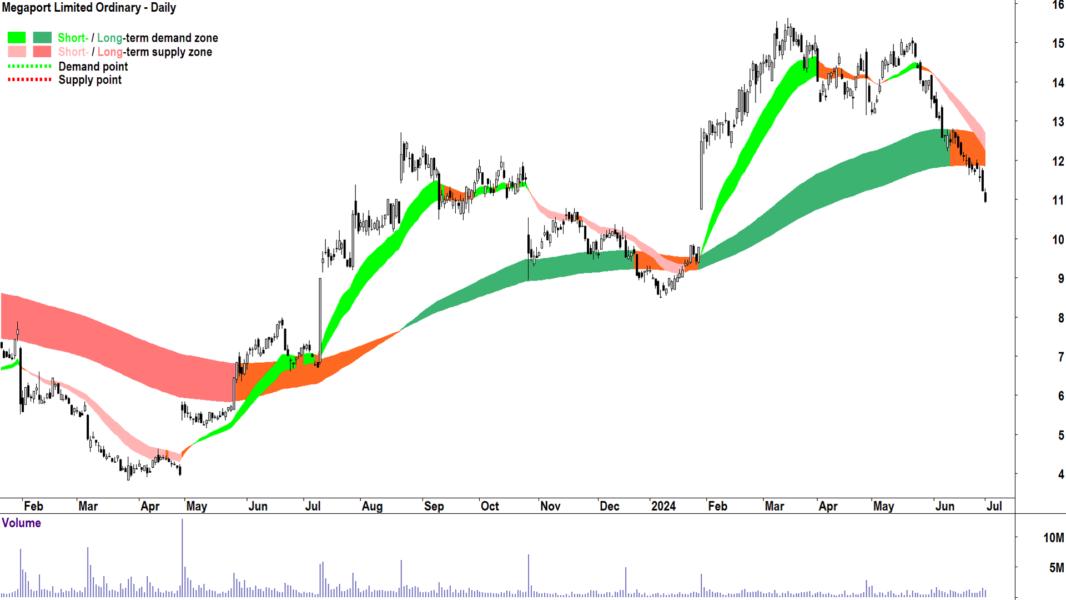
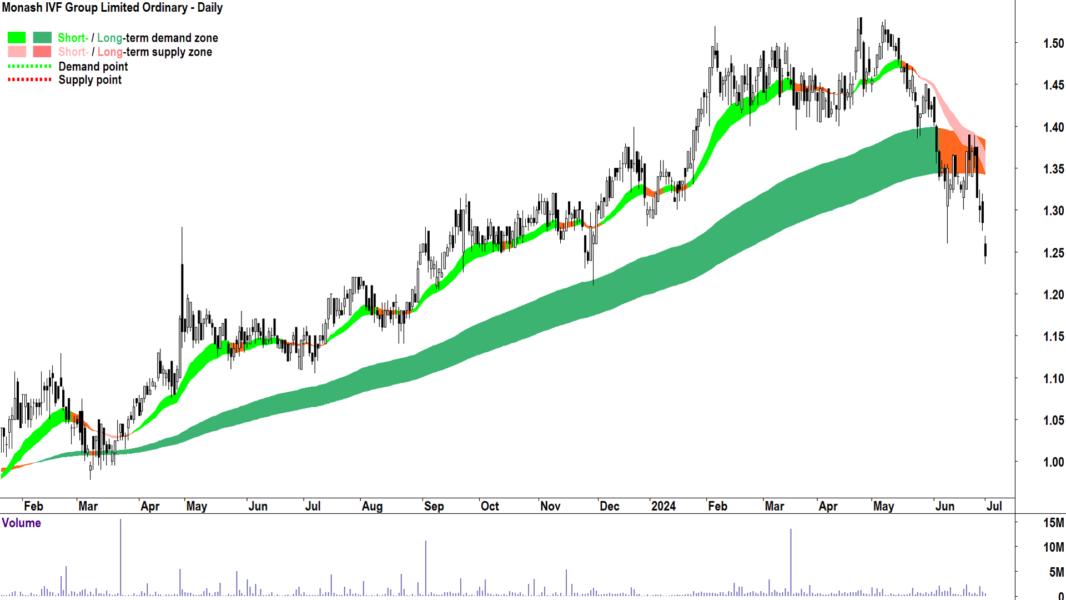
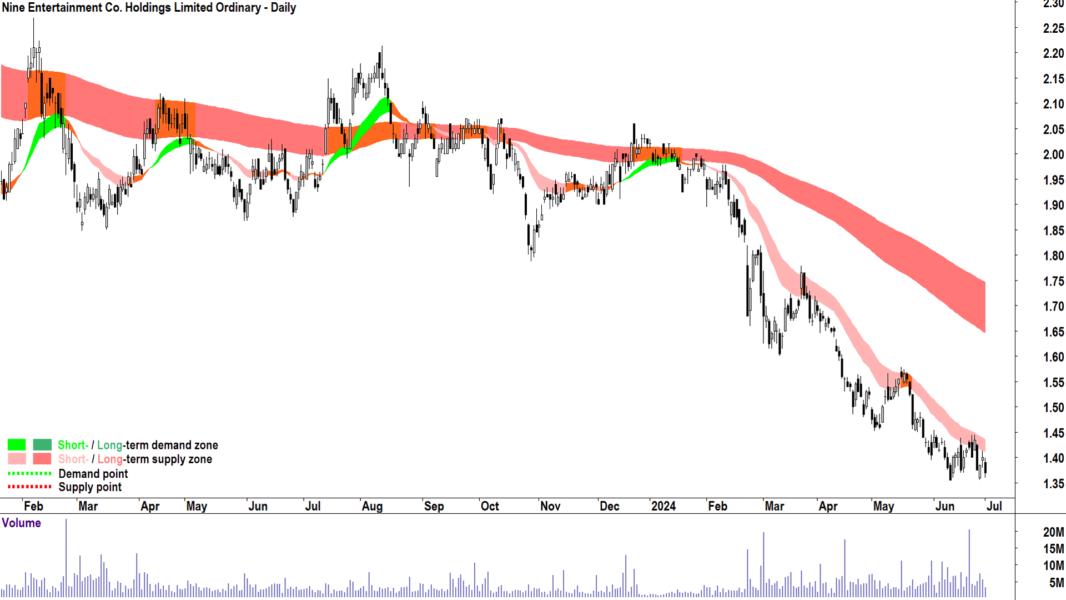
- Interesting downtrends in today's Scan Lists: Audinate (AD8), Charter Hall (CHC), Ebos (EBO), Endeavour (EDV), Mirvac (MGR), Megaport (MP1), Monash (MVF), Nine (NEC), Patriot Battery Metals (PMT), Vulcan Steel (VSL), and Wildcat Resources (WC8)
Welcome to my ChartWatch Daily ASX Scans series. Here I present scan lists based on my trend following technical analysis methodology. My goal is to alert you to the best uptrends and downtrends on the ASX.
Uptrends Scan List
Company | Code | Last Price | 1mo % | 1yr % |
|---|---|---|---|---|
Actinogen Medical | ACW | $0.065 | +124.1% | +55.9% |
Aristocrat Leisure | ALL | $50.04 | +14.0% | +30.5% |
Austin Engineering | ANG | $0.580 | +16.0% | +118.9% |
Austal | ASB | $2.49 | +5.5% | +1.2% |
AUB Group | AUB | $31.38 | +8.4% | +12.0% |
Biome Australia | BIO | $0.600 | +79.1% | +757.1% |
Commonwealth Bank | CBA | $126.20 | +7.0% | +26.8% |
Dalrymple Bay Infrastructure | DBI | $2.98 | +8.0% | +12.9% |
Duratec | DUR | $1.275 | +24.4% | +12.8% |
Encounter Resources | ENR | $0.780 | +129.4% | +231.9% |
Energy One | EOL | $5.10 | +17.2% | +72.7% |
Genusplus Group | GNP | $2.03 | +10.0% | +95.2% |
Genetic Signatures | GSS | $0.760 | +4.1% | +23.5% |
Kelly Partners Group | KPG | $8.25 | +10.1% | +78.2% |
Loftus Peak Global Disruption Fund ETF | LPGD | $4.70 | +4.0% | +45.5% |
MFF Capital Investments | MFF | $3.70 | +5.1% | +41.8% |
Mitre Mining Corporation | MMC | $0.790 | +11.3% | +259.1% |
Metro Mining | MMI | $0.054 | +10.2% | +184.2% |
Macquarie Group | MQG | $203.16 | +7.9% | +16.1% |
Myer | MYR | $0.820 | +26.2% | +37.8% |
National Australia Bank | NAB | $36.07 | +7.3% | +37.4% |
New Hope Corporation | NHC | $5.10 | +5.2% | +7.7% |
News Corporation | NWS | $42.89 | +4.4% | +46.8% |
OFX Group | OFX | $2.20 | +2.8% | +11.7% |
Origin Energy | ORG | $10.93 | +8.2% | +30.1% |
Propel Funeral Partners | PFP | $5.77 | +6.7% | +39.0% |
Steadfast Group | SDF | $6.14 | +12.7% | +3.5% |
Stanmore Resources | SMR | $3.72 | +19.6% | +47.4% |
Ventia Services Group | VNT | $3.86 | +10.0% | +30.0% |
West African Resources | WAF | $1.590 | +11.2% | +90.4% |
Westpac Banking Corporation | WBC | $27.21 | +4.9% | +27.8% |
Webjet | WEB | $8.89 | +3.1% | +28.7% |
Xero | XRO | $134.70 | +0.5% | +17.4% |
Yancoal Australia | YAL | $6.92 | +7.3% | +55.2% |
Today's Uptrends Scan List
Interesting charts from today's Uptrends List 🔎📈
The stocks that I feel are showing the strongest excess demand from today's Uptrends List are: Metro Mining MMI, Origin Energy
ORG, Stanmore Resources
SMR, Yancoal Australia
YAL.
Charts of each below:
Downtrends Scan List
Company | Code | Last Price | 1mo % | 1yr % |
|---|---|---|---|---|
Audinate Group | AD8 | $15.34 | +2.4% | +69.7% |
Australian Finance Group | AFG | $1.365 | -6.8% | -19.9% |
Auckland International Airport | AIA | $6.98 | +0.7% | -10.3% |
Eagers Automotive | APE | $10.44 | +3.1% | -17.3% |
Brainchip | BRN | $0.210 | -14.3% | -42.5% |
Charter Hall Group US Prohibited | CHC | $11.27 | -6.1% | +2.3% |
Core Lithium | CXO | $0.091 | -32.6% | -90.1% |
Dicker Data | DDR | $9.47 | +3.0% | +15.5% |
Ebos Group | EBO | $29.37 | -10.0% | -11.5% |
Endeavour Group | EDV | $4.96 | +1.4% | -21.1% |
GDI Property Group | GDI | $0.560 | -6.7% | -15.8% |
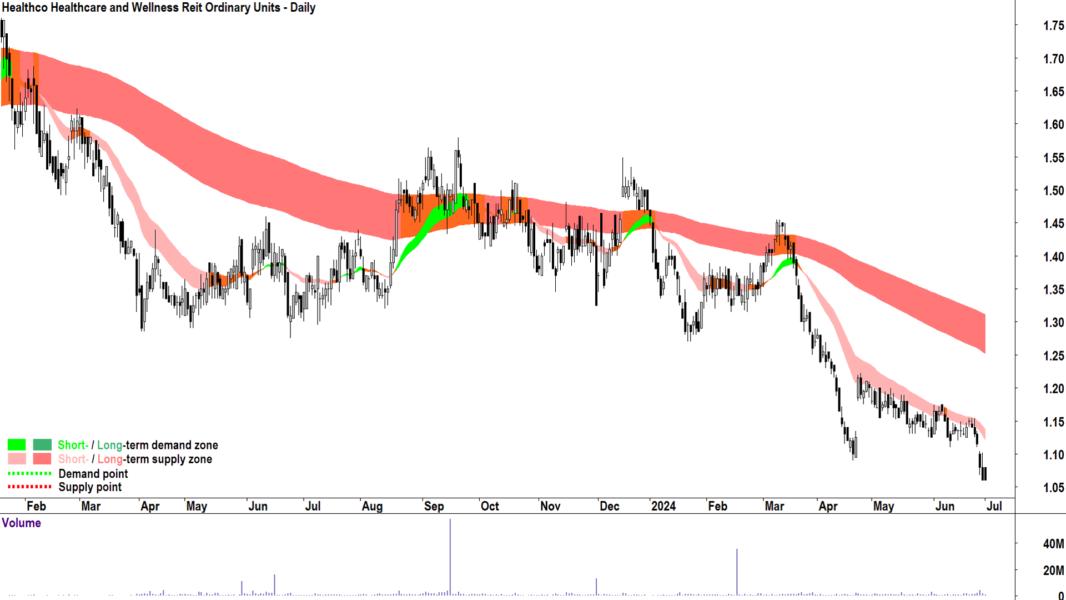
Healthco Healthcare and Wellness Reit | HCW | $1.060 | -6.6% | -21.2% |
Imugene | IMU | $0.055 | -17.9% | -35.3% |
Ioneer | INR | $0.140 | -31.7% | -56.3% |
Lotus Resources | LOT | $0.330 | -26.7% | +83.3% |
Latin Resources | LRS | $0.170 | -32.0% | -39.3% |
Arcadium Lithium | LTM | $4.95 | -23.8% | 0% |
Liontown Resources | LTR | $0.890 | -30.5% | -69.8% |
Mirvac Group | MGR | $1.855 | -4.1% | -19.7% |
Megaport | MP1 | $10.95 | -22.0% | +57.3% |
Monash IVF Group | MVF | $1.245 | -12.3% | +10.2% |
Nine Entertainment | NEC | $1.370 | -2.8% | -28.8% |
OOH!Media | OML | $1.345 | -7.2% | +11.6% |
Patriot Battery Metals | PMT | $0.535 | -37.4% | -70.0% |
Sayona Mining | SYA | $0.034 | -17.1% | -80.0% |
Vulcan Steel | VSL | $6.50 | -7.3% | -16.8% |
Weebit Nano | WBT | $2.35 | +2.2% | -58.8% |
Wildcat Resources | WC8 | $0.315 | -25.0% | +162.5% |
Today's Downtrends Scan List
Interesting charts from today's Downtrends List 🔎📉
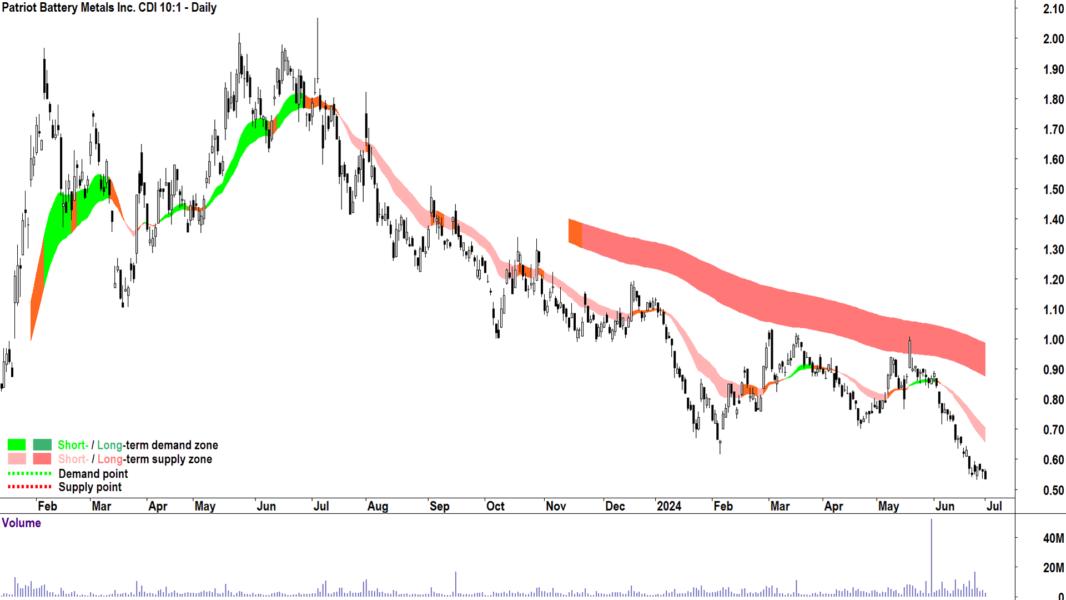
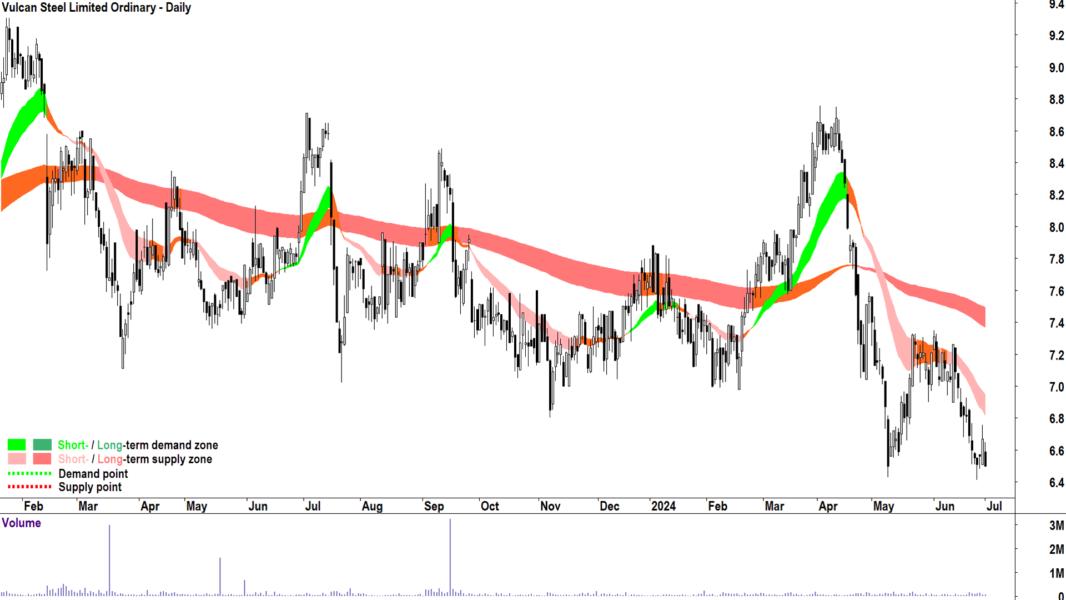
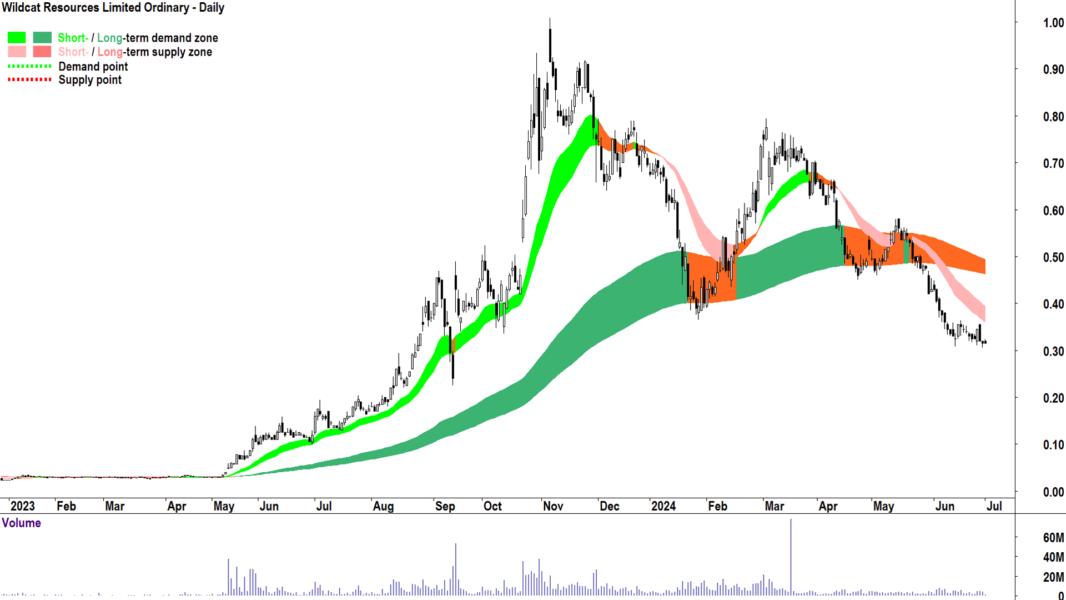
The stocks that I feel are showing the strongest excess supply from today's Downtrends List are: Audinate Group AD8, Charter Hall Group US Prohibited
CHC, Ebos Group
EBO, Endeavour Group
EDV, Healthco Healthcare and Wellness Reit
HCW, Mirvac Group
MGR, Megaport
MP1, Monash IVF Group
MVF, Nine Entertainment
NEC, Patriot Battery Metals
PMT, Vulcan Steel
VSL, Wildcat Resources
WC8.
Charts of each below:

ChartWatch ASX Scans Criteria
Criteria for Uptrends List
Short term uptrend (ST trend ribbon is light green)
Long term uptrend or long term trend is transitioning from down to up (LT trend ribbon is dark green, or LT trend ribbon is amber and contracting)
Demand-side price action (rising peaks and rising troughs is preferred, but based upon weight of evidence of other criteria rising peaks only or rising troughs only may be permitted)
Predominance of demand-side candles (i.e., white bodies and or downward pointing shadows)
The last candle in particular is a strong demand-side candle
Criteria for Downtrends List
Short term downtrend (ST trend ribbon is light pink)
Long term downtrend or long term trend is transitioning from up to down (LT trend ribbon is dark pink, or LT trend ribbon is amber and contracting)
Supply-side price action (falling peaks and falling troughs is preferred, but based upon weight of evidence of other criteria falling peaks only or falling troughs only may be permitted)
Predominance of supply-side candles (i.e., black bodies and or upward pointing shadows)
The last candle in particular is a strong supply-side candle
Important considerations when using the ChartWatch ASX Scan Lists:
1. The future is unknown. Anything can happen to change the trends in the lists above. A stock in a perfect uptrend or downtrend may not remain that way by the close of trading today. 2. These lists are not exhaustive, they are curated by Carl. You will find that certain stocks might not appear in a particular list on consecutive days but might reappear when Carl feels it deserves to return to the list. 3. This is not a recommendation service, merely an aid to help you better understand the workings of Carl’s technical analysis model in a practical way. Carl will not alert you to stocks that have dropped off a list because their trend has changed – it is up to you to apply the criteria to determine why a particular stock might not still be included. 4. This is general, educational information only – always do your own research.