ChartWatch ASX Scans: CBA's best chart status continues vs bundle of pain, not joy for MVF buy the dip theory
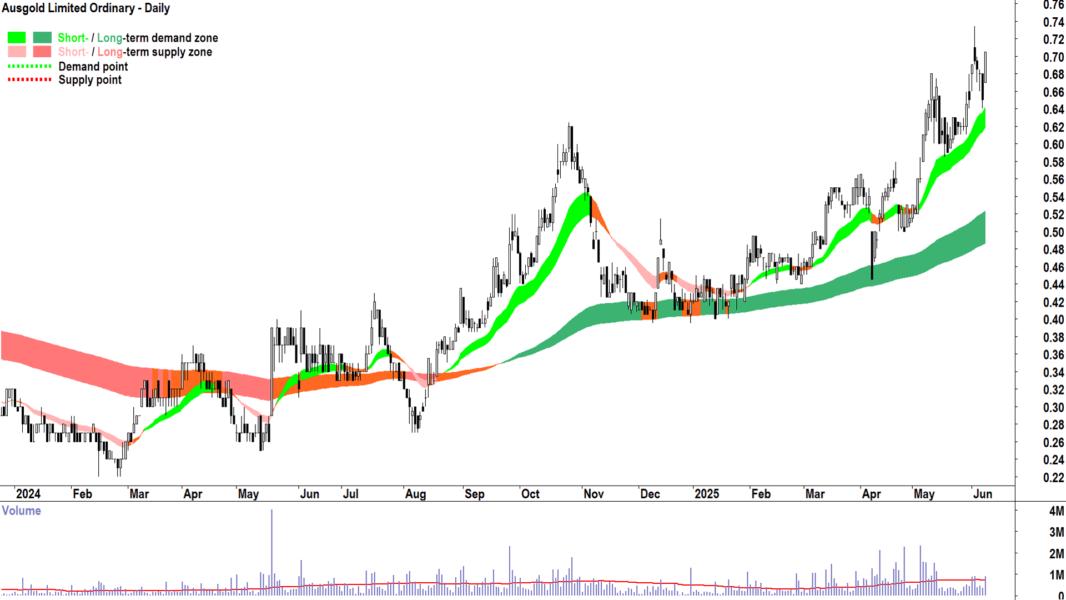
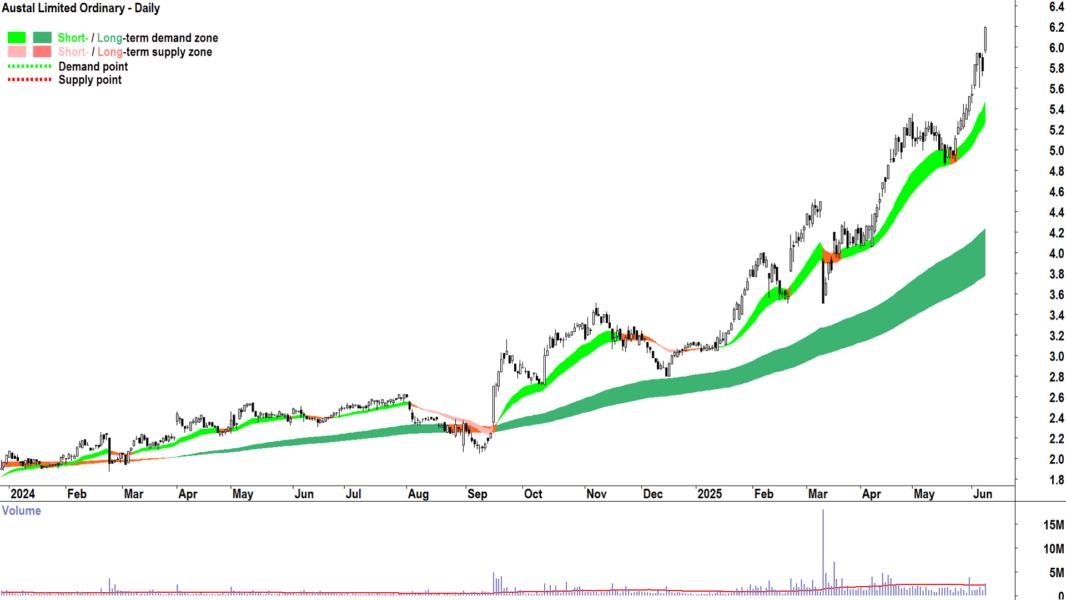
- Interesting uptrends in today's Scans: Austal (ASB), Ausgold (AUC), Antipa Minerals (AZY), Commonwealth Bank (CBA), Digitalx (DCC), Droneshield (DRO), EVT (EVT), Goodman (GMG), Lynas Rare Earths (LYC), Pro Medicus (PME), Xero (XRO), Zip Co. (ZIP).
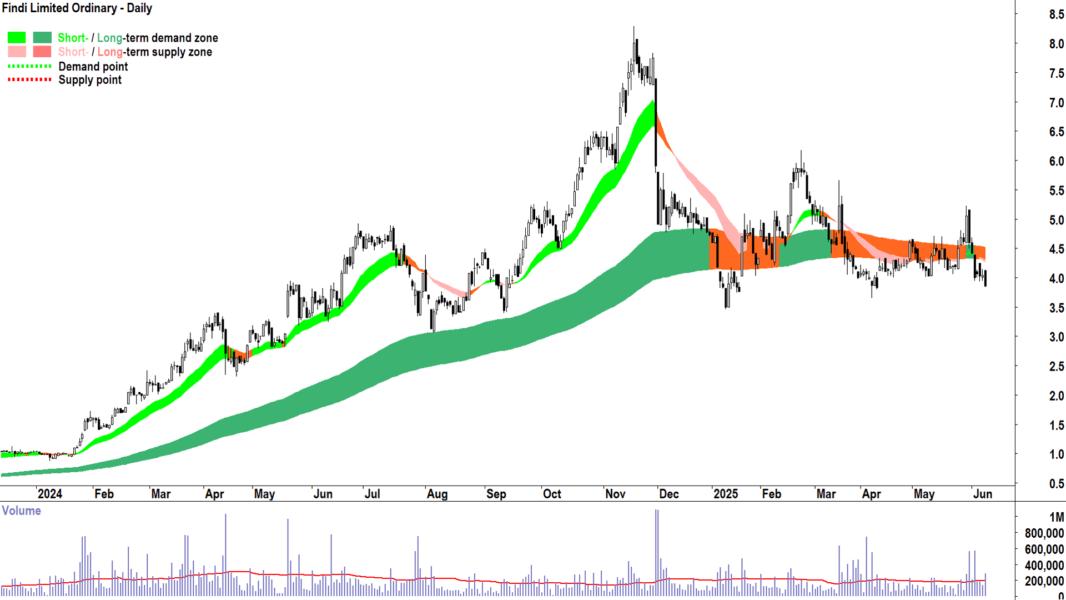
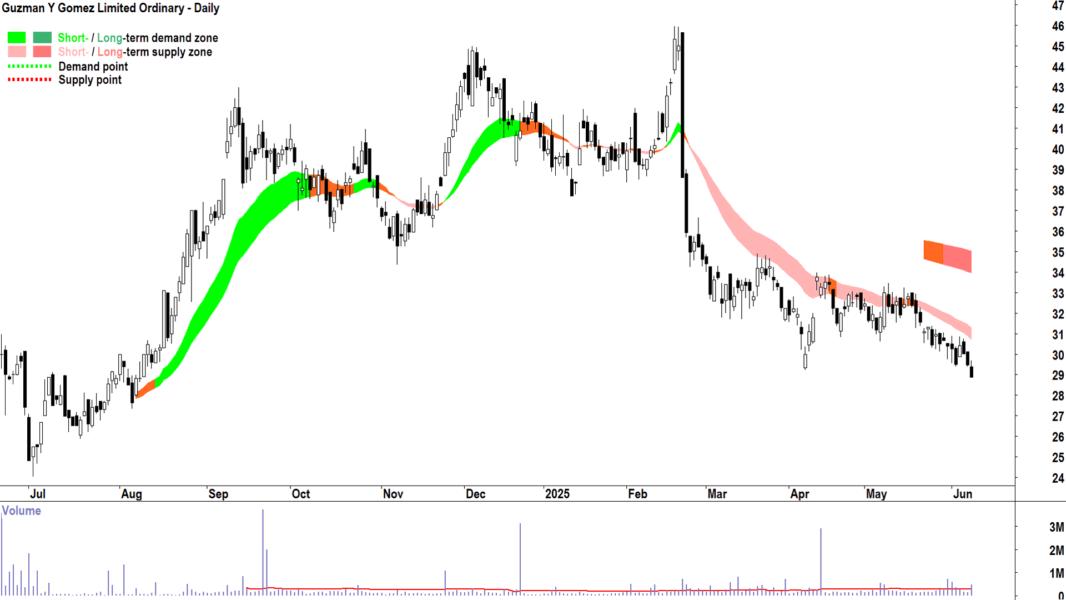
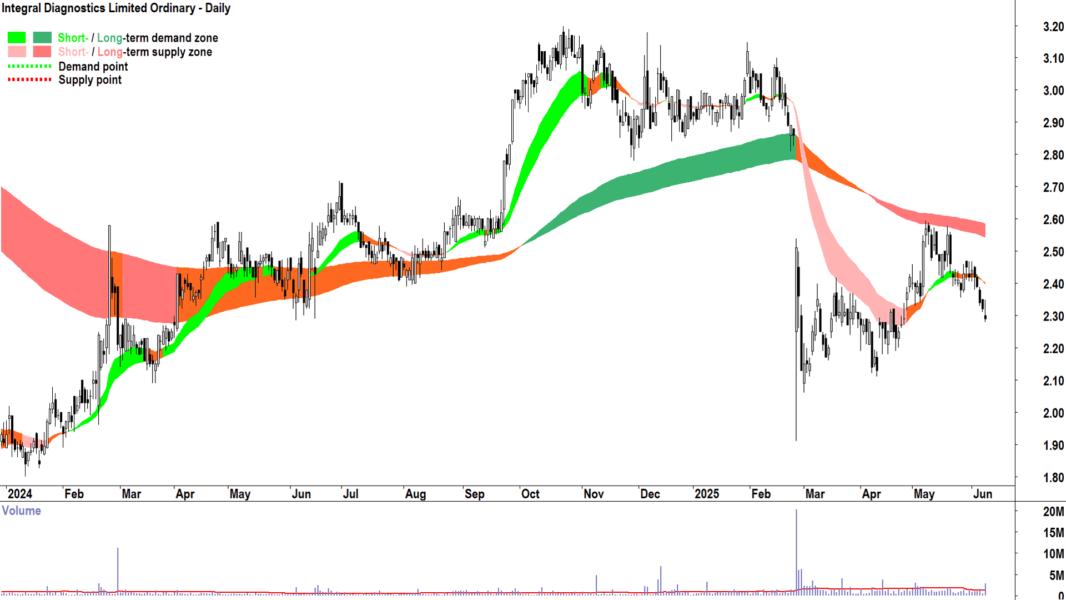
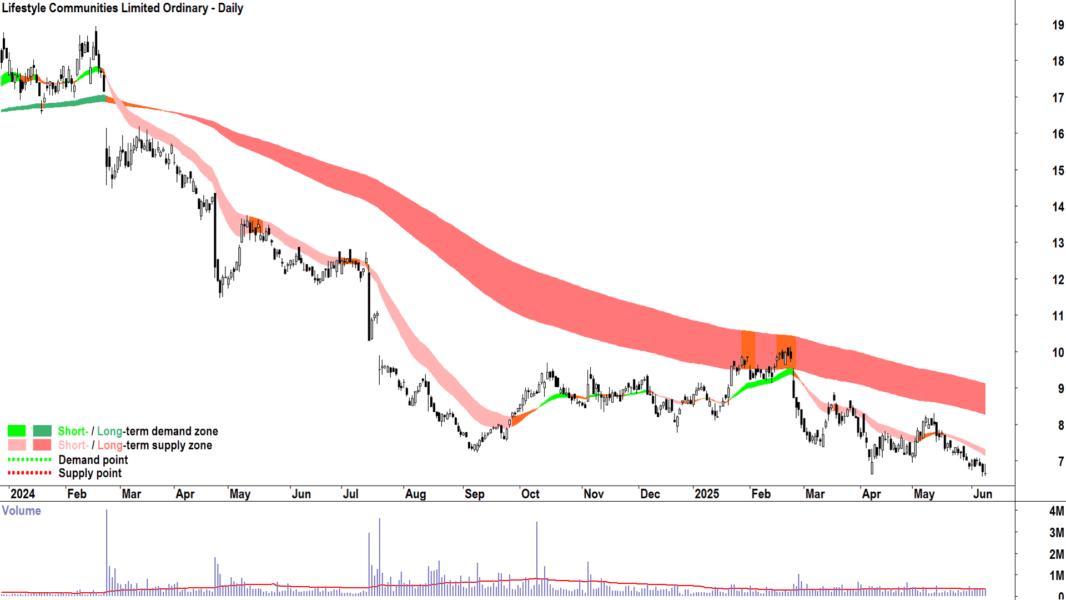
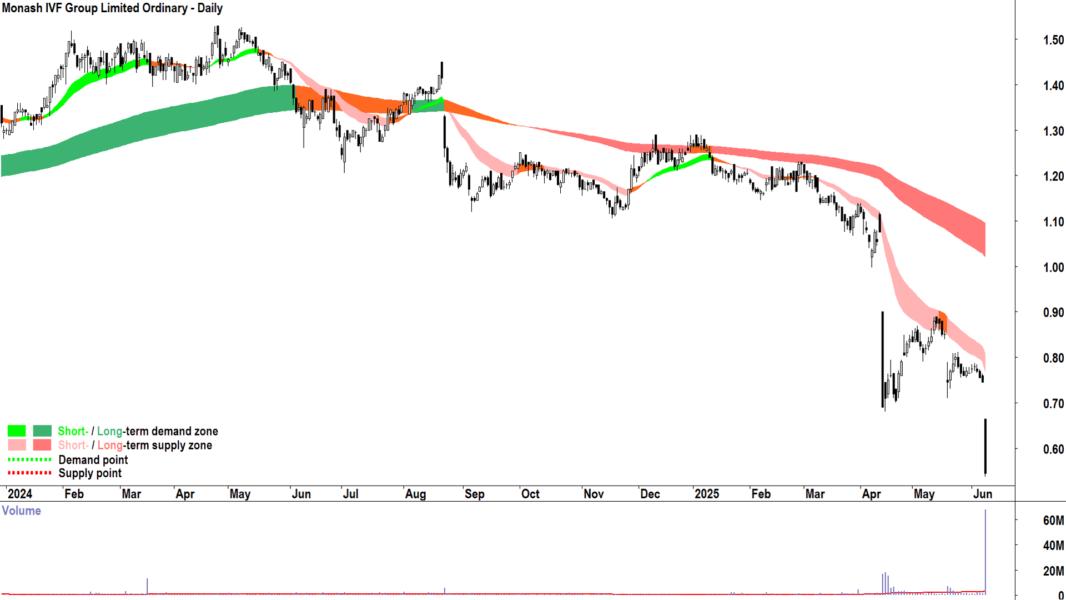
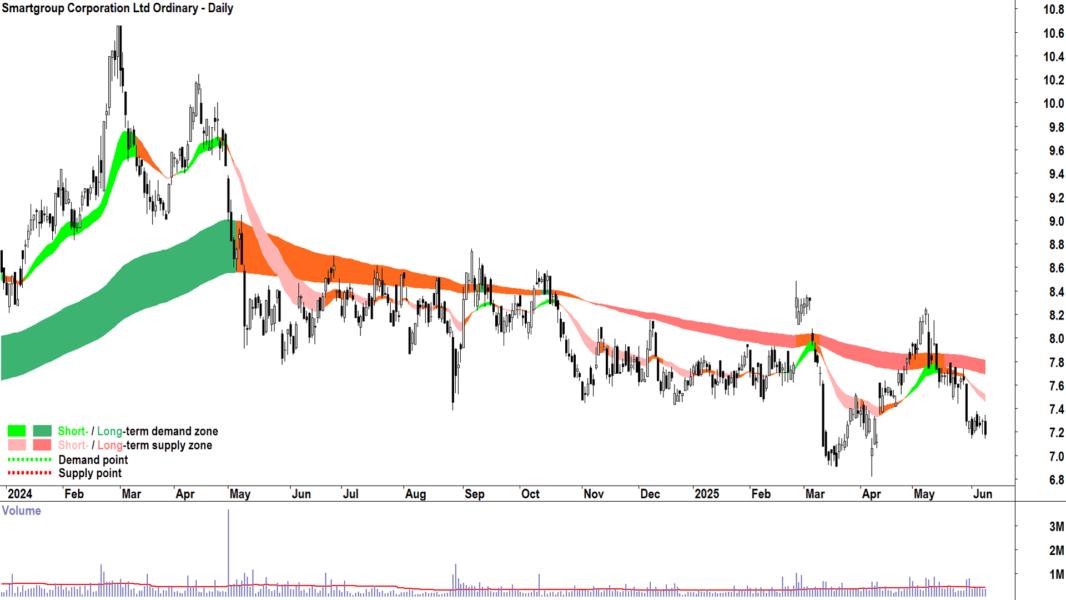
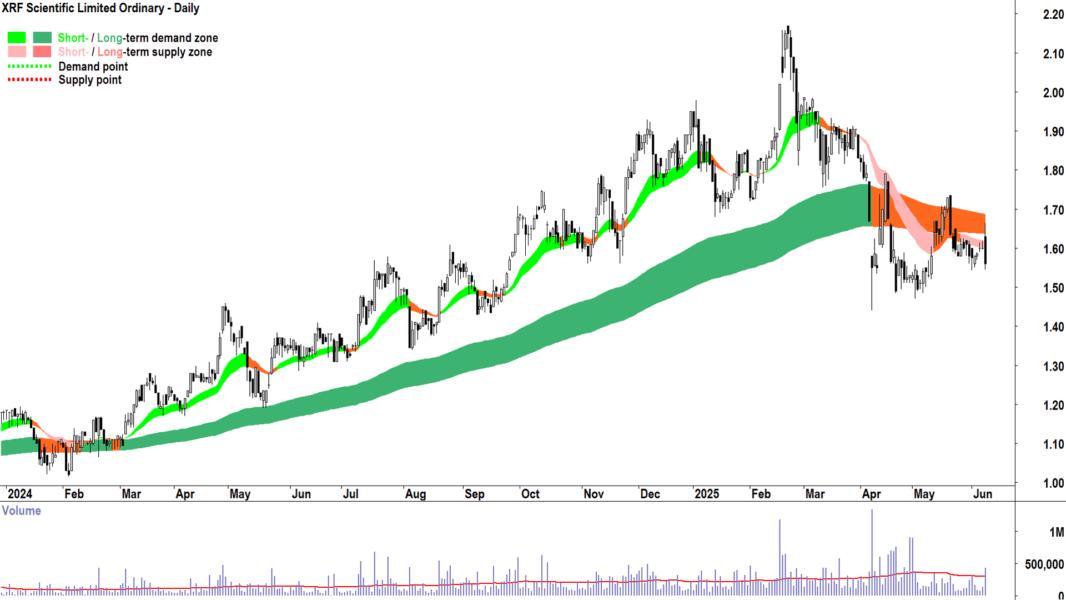
- Interesting downtrends in today's Scans: Appen (APX), Findi (FND), Guzman y Gomez (GYG), Integral Diagnostics (IDX), Lifestyle Communities (LIC), Monash IVF (MVF), Platinum Asset Management (PTM), Smartgroup (SIQ), XRF Scientific (XRF).
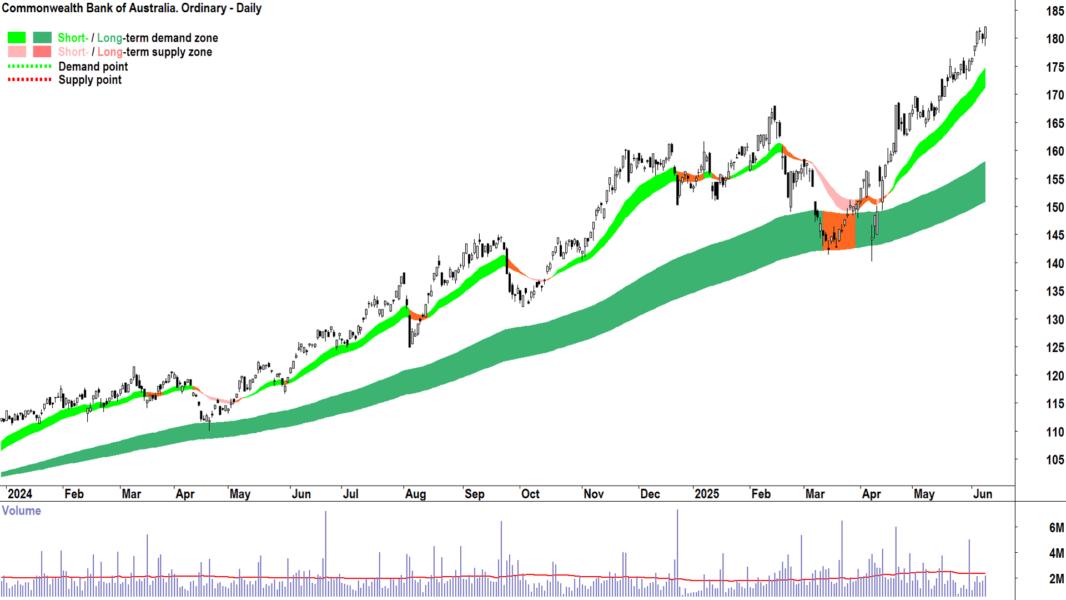
Scroll down to the Feature Charts and look at two charts for me. First, in the Feature Uptrends group, check out the chart of Commonwealth Bank of Australia (CBA).
Would you say CBA looks cheap or expensive? 🤔
Okay. Great. Now scroll a bit further on and in the Feature Downtrends group, check out the chart of Monash IVF (MVF).
Would you say MVF looks cheap or expensive? 🤔
There's no right or wrong answer, but a trend follower trains their brain to believe without question that the CBA chart corresponds to a cheap stock's chart and that the MVF chart corresponds to an expensive stock's chart 💯.
It's really that simple.
Prior to today (last 12 months):
CBA = 58 x Feature Uptrends (plus countless regular Uptrend Scan list appearances)
MVF = 13 x Feature Downtrends (plus countless regular Downtrend Scan list appearances)
The notion of what expensive or cheap looks like will be a paradigm shift for many investors...yet many more will never know or experience it...😭
Paradigm Shift. Source Investopedia
Welcome to my ChartWatch Daily ASX Scans series. Here I present scan lists based on my trend following technical analysis methodology. My goal is to alert you to the best uptrends and downtrends on the ASX.
Feel free to get your favourite AI to convert the tables below into lists you can upload to your favourite trading platform like TradingView. Then you'll be able to skip from chart to chart and quickly and easily see the best uptrends and downtrends on the ASX.
Some investors prefer to buy those stocks in strong uptrends, and avoid, sell, or short sell those stocks in strong downtrends – but how you use the lists is really up to you!
Note, many stocks in both lists have appeared there many times before. As long as they keep meeting my criteria – they'll keep appearing. But note, there won't be any notifications when they don't, so you'll have to do your own research on when a particular trend changes!
Uptrends Scan List
Company | Code | Last Price | 1mo % | 1yr % |
BetaShares Australia 200 ETF | A200 | $143.95 | +4.6% | +10.7% |
Antipodes Global Shares ETF | AGX1 | $6.98 | +4.2% | +17.3% |
AMA Group | AMA | $0.105 | +32.9% | +173.0% |
Aspen Group | APZ | $3.76 | +22.9% | +112.4% |
Austal | ASB | $6.19 | +18.4% | +151.6% |
Global X Uranium ETF | ATOM | $18.77 | +29.4% | +16.2% |
Ausgold | AUC | $0.705 | +9.3% | +101.4% |
Antipa Minerals | AZY | $0.755 | +55.7% | +403.3% |
Car Group | CAR | $36.20 | +3.1% | +1.4% |
Catapult Group International | CAT | $6.25 | +47.8% | +249.2% |
Commonwealth Bank of Australia | CBA | $182.00 | +9.0% | +47.4% |
Cobram Estate Olives | CBO | $2.05 | +9.6% | +9.6% |
Digitalx | DCC | $0.078 | +32.2% | +47.1% |
Droneshield | DRO | $1.645 | +21.4% | +28.5% |
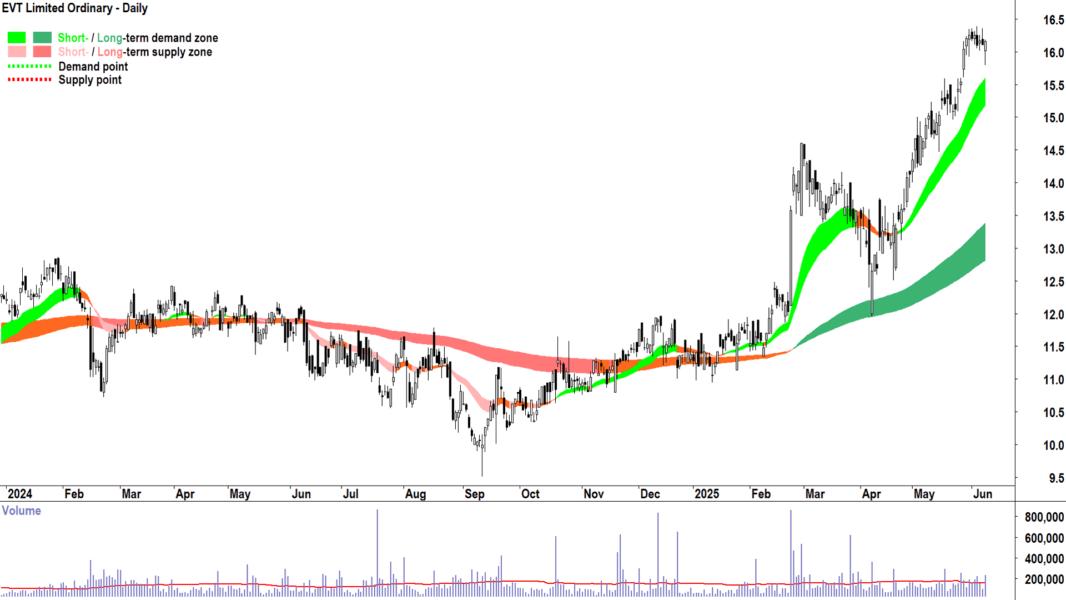
EVT | EVT | $16.16 | +7.6% | +36.5% |
BetaShares Geared Australian Equity Fund ETF | GEAR | $34.51 | +10.1% | +22.3% |
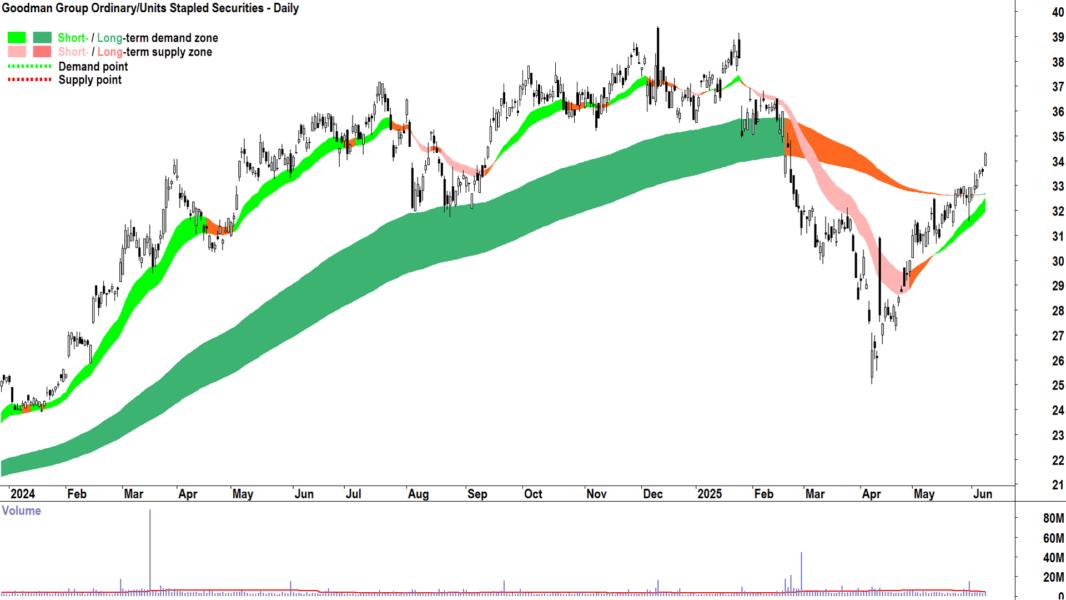
Goodman Group | GMG | $34.27 | +9.3% | -0.2% |
GR Engineering Services | GNG | $3.03 | +12.6% | +40.3% |
Vaneck India Growth Leaders ETF | GRIN | $21.58 | +13.8% | 0% |
Lovisa | LOV | $33.09 | +25.0% | +8.4% |
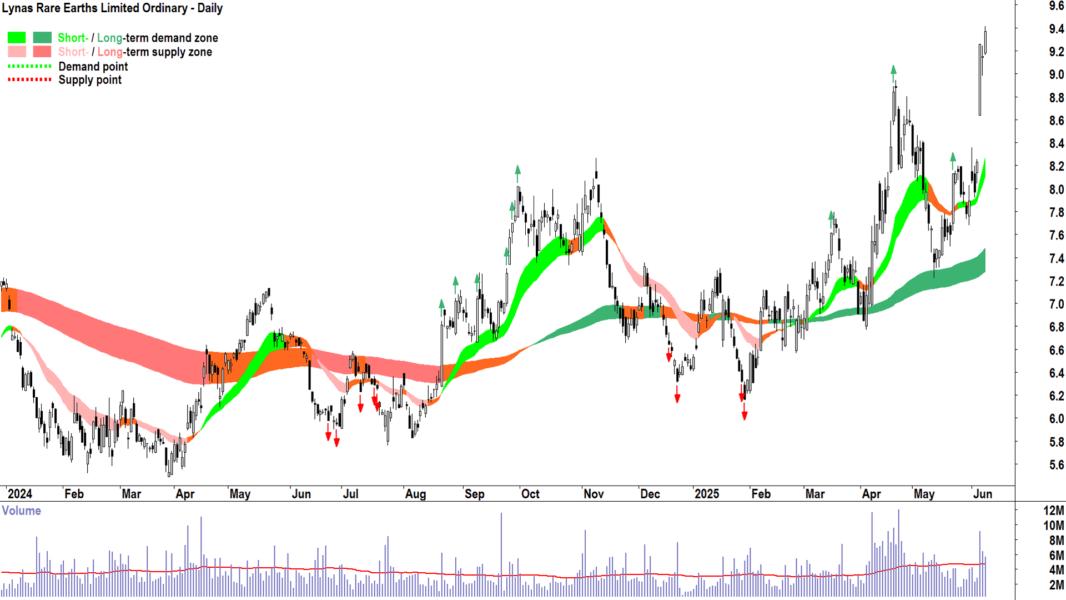
Lynas Rare Earths | LYC | $9.37 | +21.7% | +40.7% |
MA Financial Group | MAF | $7.34 | +13.4% | +58.2% |
Mirvac Group | MGR | $2.35 | +0.4% | +16.3% |
Macquarie Group | MQG | $218.34 | +7.4% | +13.0% |
National Australia Bank | NAB | $39.17 | +7.2% | +12.6% |
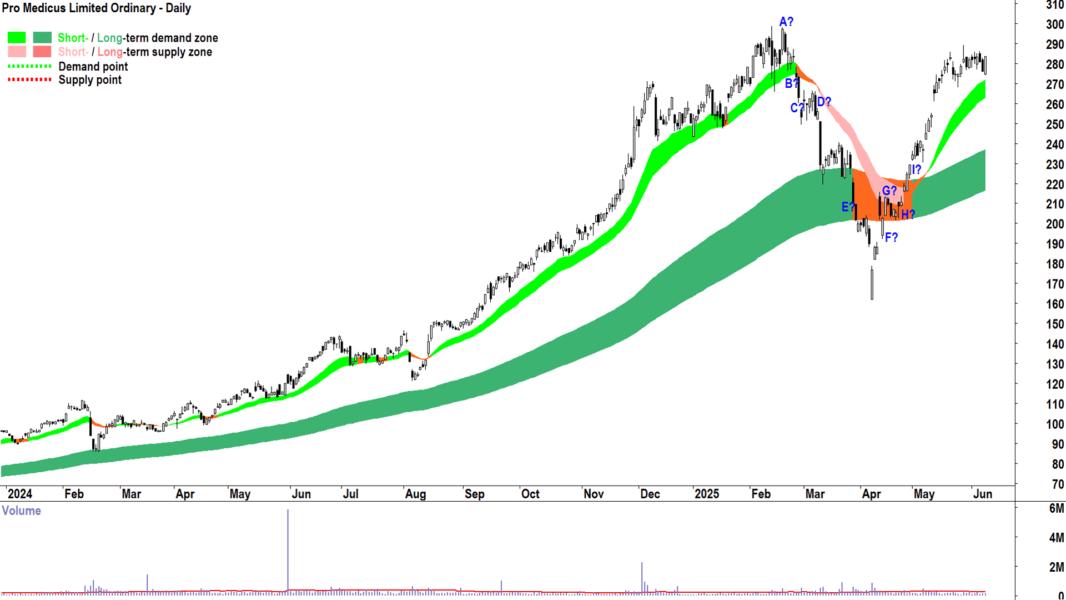
Pro Medicus | PME | $283.48 | +12.6% | +130.6% |
Qube | QUB | $4.34 | +3.6% | +17.6% |
Resmed Inc | RMD | $38.85 | +1.7% | +22.2% |
Tabcorp | TAH | $0.740 | +5.7% | +21.3% |
Technology One | TNE | $42.61 | +33.1% | +136.3% |
Vicinity Centres | VCX | $2.48 | +1.2% | +27.5% |
Vanguard MSCI International Small Companies Index ETF | VISM | $68.50 | +4.2% | +10.2% |
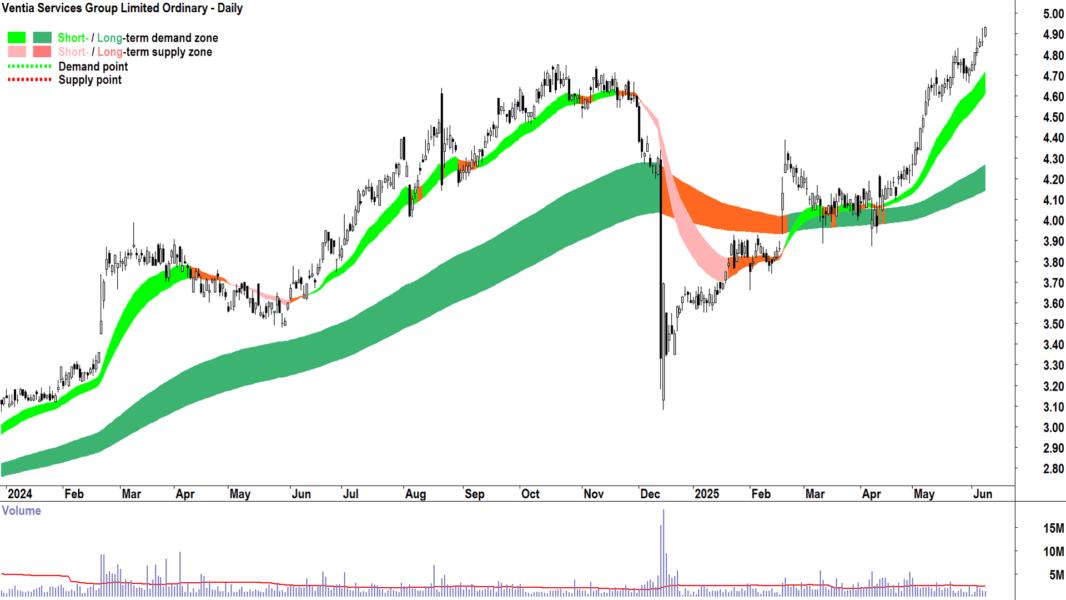
Ventia Services Group | VNT | $4.93 | +6.3% | +34.3% |
Wesfarmers | WES | $85.33 | +6.3% | +30.1% |
Wisetech Global | WTC | $108.01 | +12.3% | +13.2% |
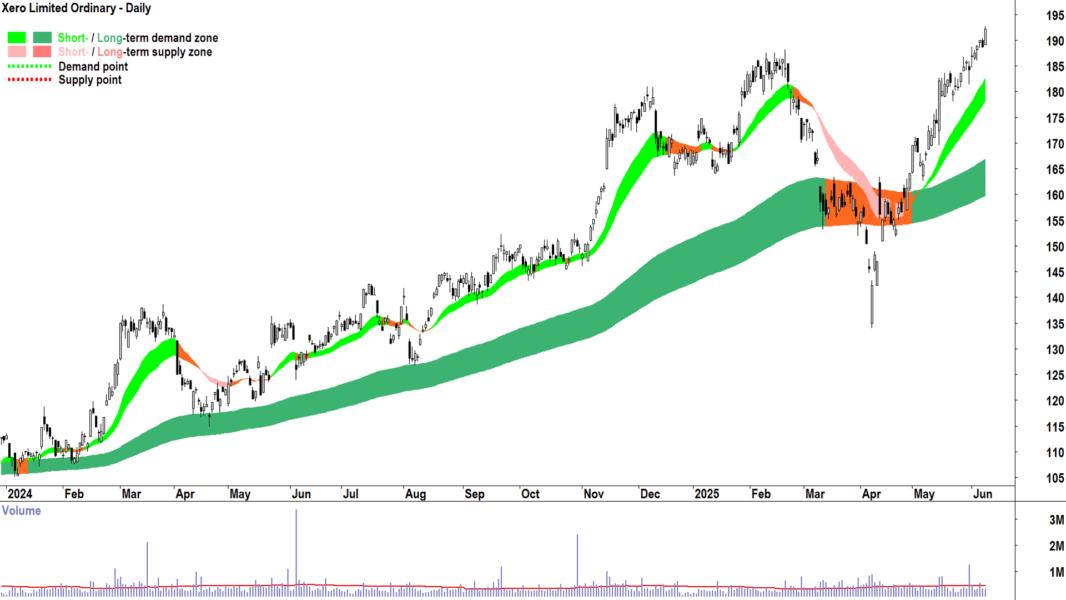
Xero | XRO | $192.10 | +11.4% | +52.5% |
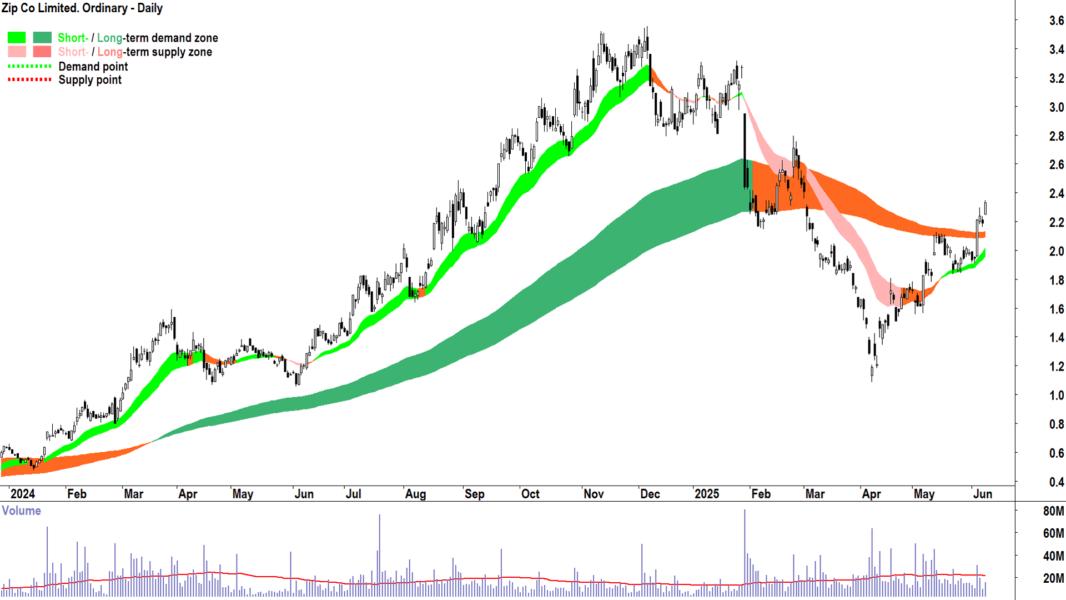
Zip Co. | ZIP | $2.33 | +24.9% | +116.7% |
Today's Uptrends Scan List
Feature Charts from today's Uptrends List 🔎📈
The stocks that I feel are showing the strongest excess demand from today's Uptrends List are: AMA Group ![]() AMA, Aspen Group
AMA, Aspen Group ![]() APZ, Austal
APZ, Austal ![]() ASB, Ausgold
ASB, Ausgold ![]() AUC, Antipa Minerals
AUC, Antipa Minerals ![]() AZY, Catapult Group International
AZY, Catapult Group International ![]() CAT, Commonwealth Bank of Australia
CAT, Commonwealth Bank of Australia ![]() CBA, Digitalx
CBA, Digitalx ![]() DCC, Droneshield
DCC, Droneshield ![]() DRO, EVT
DRO, EVT ![]() EVT, Goodman Group
EVT, Goodman Group ![]() GMG, GR Engineering Services
GMG, GR Engineering Services ![]() GNG, Lynas Rare Earths
GNG, Lynas Rare Earths ![]() LYC, MA Financial Group
LYC, MA Financial Group ![]() MAF, Pro Medicus
MAF, Pro Medicus ![]() PME, Tabcorp
PME, Tabcorp ![]() TAH, Technology One
TAH, Technology One ![]() TNE, Vanguard MSCI International Small Companies Index ETF
TNE, Vanguard MSCI International Small Companies Index ETF ![]() VISM, Ventia Services Group
VISM, Ventia Services Group ![]() VNT, Wesfarmers
VNT, Wesfarmers ![]() WES, Wisetech Global
WES, Wisetech Global ![]() WTC, Xero
WTC, Xero ![]() XRO, Zip Co.
XRO, Zip Co. ![]() ZIP.
ZIP.
10 Randomly Picked Feature Charts below:
Downtrends Scan List
Company | Code | Last Price | 1mo % | 1yr % |
Alpha HPA | A4N | $0.845 | -15.1% | -5.6% |
Amotiv | AOV | $7.84 | -3.2% | -25.3% |
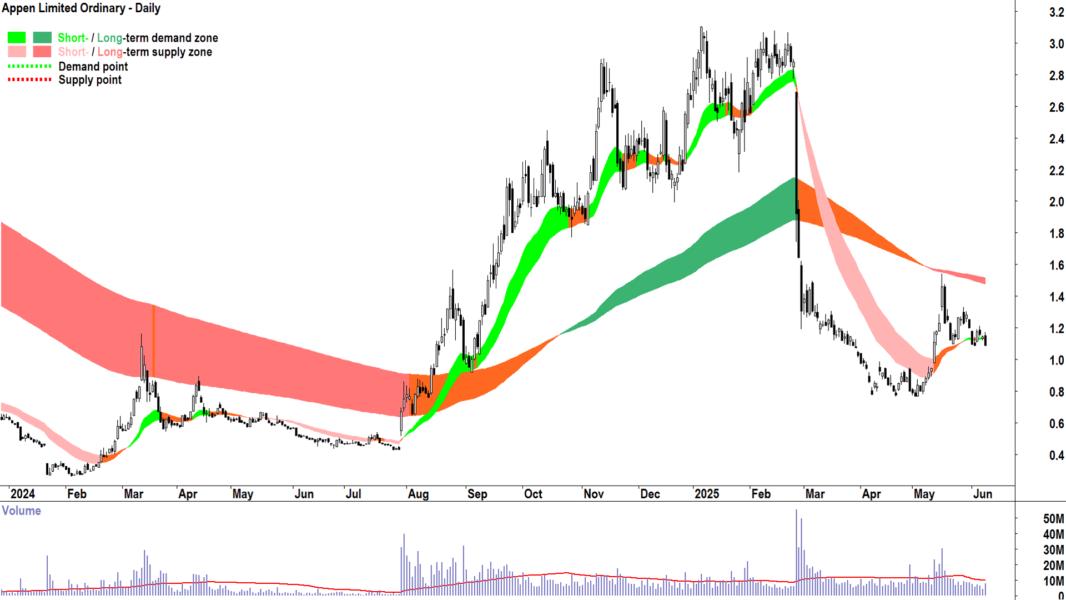
Appen | APX | $1.090 | +19.1% | +109.6% |
Accent Group | AX1 | $1.845 | -4.9% | -4.9% |
Findi | FND | $3.86 | -4.2% | -0.5% |
Guzman y Gomez | GYG | $28.87 | -10.7% | 0% |
Healthco Health and Wellness Reit | HCW | $0.765 | -7.8% | -34.3% |
Humm Group | HUM | $0.440 | -14.6% | +1.1% |
Horizon Oil | HZN | $0.170 | -5.6% | -2.9% |
Integral Diagnostics | IDX | $2.29 | -10.5% | -3.0% |
IDP Education | IEL | $3.74 | -61.2% | -76.2% |
Iluka Resources | ILU | $3.77 | -7.6% | -47.6% |
Ioneer | INR | $0.115 | -17.9% | -36.1% |
IPD Group | IPG | $2.95 | -24.2% | -31.6% |
Lifestyle Communities | LIC | $6.65 | -16.8% | -47.3% |
Monash IVF Group | MVF | $0.545 | -34.7% | -59.3% |
Nuix | NXL | $2.32 | +2.2% | -20.8% |
Platinum Asset Management | PTM | $0.525 | -17.3% | -31.3% |
PWR Holdings | PWH | $6.27 | -9.3% | -42.0% |
Redox | RDX | $2.07 | -26.1% | -34.7% |
Smartgroup Corporation | SIQ | $7.18 | -7.2% | -11.5% |
Vulcan Steel | VSL | $6.38 | -10.1% | -9.4% |
XRF Scientific | XRF | $1.560 | +2.0% | +16.4% |
Today's Downtrends Scan List
Feature Charts from today's Downtrends List 🔎📉
The stocks that I feel are showing the strongest excess supply from today's Downtrends List are: Appen ![]() APX, Findi
APX, Findi ![]() FND, Guzman y Gomez
FND, Guzman y Gomez ![]() GYG, Integral Diagnostics
GYG, Integral Diagnostics ![]() IDX, Lifestyle Communities
IDX, Lifestyle Communities ![]() LIC, Monash IVF Group
LIC, Monash IVF Group ![]() MVF, Platinum Asset Management
MVF, Platinum Asset Management ![]() PTM, Smartgroup Corporation
PTM, Smartgroup Corporation ![]() SIQ, XRF Scientific
SIQ, XRF Scientific ![]() XRF.
XRF.
Charts of each below:

Important considerations when using the ChartWatch Daily ASX Scans:
1. The future is unknown. Anything can happen to change the trends in the lists above. A stock in a perfect uptrend or downtrend may not remain that way by the close of trading today. 2. These lists are not exhaustive, they are curated by Carl. You will find that certain stocks might not appear in a particular list on consecutive days but might reappear when Carl feels it deserves to return to the list. 3. This is not a recommendation service, merely an aid to help you better understand the workings of Carl’s technical analysis model in a practical way. Carl will not alert you to stocks that have dropped off a list because their trend has changed – it is up to you to apply the criteria to determine why a particular stock might not still be included. 4. This is general, educational information only – always do your own research.