OPEN-SOURCE SCRIPT
Gold Price Trend Overlay
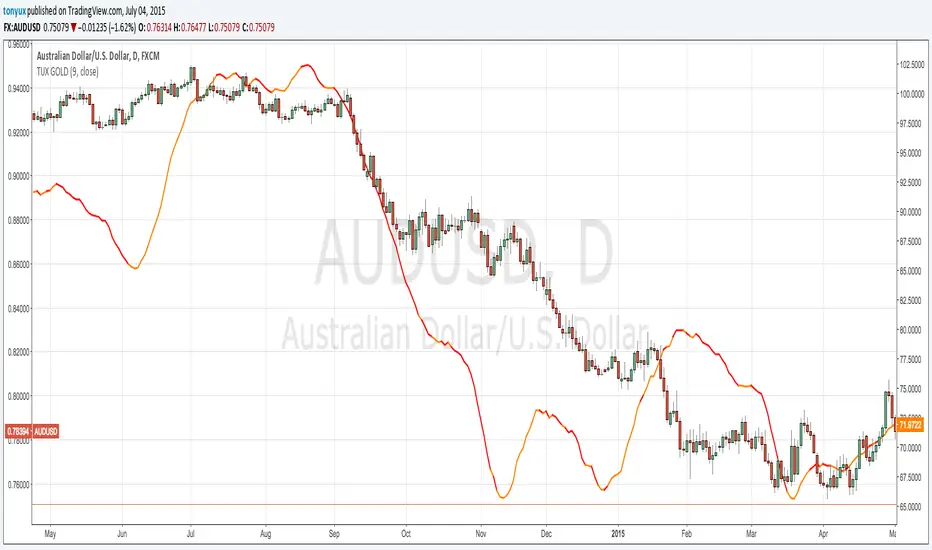
This chart overlay provides the daily 9 SMA of Gold.
If the price of GOLD is ABOVE the 9 SMA then the line will be GOLD
If the price of GOLD is BELOW the 9 SMA then the line will be RED
A good way to use this overlay is by understanding how Gold effects currency pairs.
if GOLD is BULLISH - then AUD/USD is BULLISH
if GOLD is BULLISH - then NZD/USD is BULLISH
if GOLD is BULLISH - then EUR/USD is BULLISH
if GOLD is BULLISH - then USD is bearish
if GOLD is BULLISH - then USD/CHF is BEARISH
if GOLD is BULLISH - then USD/CAD is BEARISH
Skrip sumber terbuka
Dalam semangat TradingView sebenar, pencipta skrip ini telah menjadikannya sumber terbuka, jadi pedagang boleh menilai dan mengesahkan kefungsiannya. Terima kasih kepada penulis! Walaupuan anda boleh menggunakan secara percuma, ingat bahawa penerbitan semula kod ini tertakluk kepada Peraturan Dalaman.
Penafian
Maklumat dan penerbitan adalah tidak bertujuan, dan tidak membentuk, nasihat atau cadangan kewangan, pelaburan, dagangan atau jenis lain yang diberikan atau disahkan oleh TradingView. Baca lebih dalam Terma Penggunaan.