PROTECTED SOURCE SCRIPT
Telah dikemas kini Time Cycles SMT Detector
📊 Overview
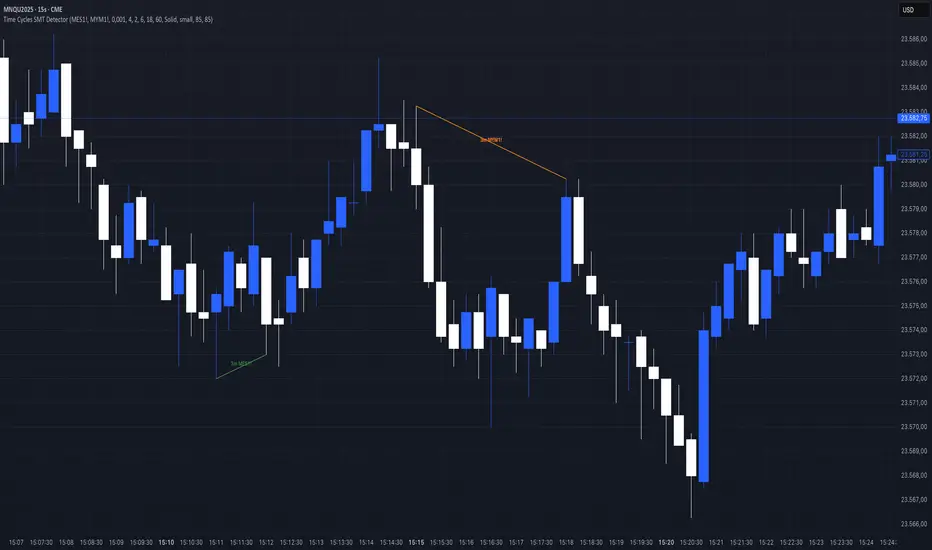
The Time Cycles SMT Detector is an advanced indicator designed to identify Smart Money Technique (SMT) divergences across multiple time cycles during the New York trading session. It compares price action between correlated instruments to spot institutional footprints and potential market reversals.
🎯 What is SMT (Smart Money Timing)?
SMT occurs when correlated markets fail to make matching highs or lows, indicating potential institutional manipulation or positioning. This divergence often precedes significant market moves.
⚙️ Key Features
Multi-Timeframe Cycle Analysis:
90-minute cycles (6 cycles per trading day) - Major institutional positioning
30-minute cycles (18 cycles per trading day) - Intermediate market structure
10-minute cycles (54 cycles per trading day) - Intraday momentum shifts
3-minute cycles (180 cycles per trading day) - Scalping opportunities
Intelligent Overlap Prevention
Hierarchical priority system prevents visual clutter
Higher timeframe SMTs take precedence over lower timeframes
Clean, readable charts even with multiple active signals
Dual Correlation Analysis
Compare your main chart with two different instruments simultaneously
Default setup: MES1! (S&P 500) and MYM1! (Dow Jones)
Fully customizable ticker selection
📈 Trading Signals
Bullish SMT
Main instrument makes a higher low while correlated instrument makes a lower low
Indicates potential upward movement
Displayed with customizable bullish colors (default: green for MES, aqua for MYM)
Bearish SMT
Main instrument makes a lower high while correlated instrument makes a higher high
Indicates potential downward movement
Displayed with customizable bearish colors (default: red for MES, orange for MYM)
🔧 Customization Options
Visual Settings:
Toggle individual timeframe cycles on/off
Customize colors for each ticker's bullish/bearish signals
Choose line styles (solid, dashed, dotted)
Show/hide cycle text labels
Optional SMT zones with adjustable transparency
Cycle boxes for visual time segmentation
Analysis Settings:
Compare only consecutive cycles or scan multiple cycles back
Adjust maximum cycles to compare (1-20)
Enable/disable bullish or bearish SMT detection separately
Real-time alerts for all timeframes
💡 How to use it
Add to your chart - Works best on 1-minute timeframe for maximum precision
Select your correlated instruments - Default MES/MYM for NQ traders
Monitor for divergences - Look for SMT lines connecting cycle highs/lows
Confirm with market context - Use alongside your existing strategy
Trade the convergence - Expect prices to realign after SMT divergence
🎓 Best Practices
Focus on higher timeframes first - 90m and 30m SMTs carry more weight
Look for confluence - Multiple timeframes showing same direction SMT
Time your entries - Use lower timeframe SMTs (10m, 3m) for precise entry timing
Respect the hierarchy - When overlapping signals occur, higher timeframes have priority
⏰ Trading Hours
The indicator operates during New York trading hours (7:00 AM - 4:00 PM ET), automatically resetting at the start of each trading day.
🚀 Why This Indicator?
Institutional Logic: Based on how smart money creates divergences before major moves
Multi-dimensional Analysis: Four different time cycles provide complete market perspective
Clean Visualization: Smart overlap prevention keeps your charts readable
Flexible Configuration: Adapt to any correlated market pairs
Real-time Alerts: Never miss a significant SMT formation
📝 Notes
Designed primarily for index futures (NQ, ES, YM) but works with any correlated instruments
Best results on 1-minute charts for accurate cycle detection
All cycles reset at 7:00 AM New York time
Maximum effectiveness during regular trading hours
Acknowledgement
This indicator is based on ICT (Inner Circle Trader) concepts and Smart Money techniques for identifying institutional order flow through market divergences.
Nota Keluaran
- Added Session SMTSkrip dilindungi
Skrip ini diterbitkan sebagai sumber tertutup. Akan tetapi, anda boleh menggunakannya secara bebas dan tanpa apa-apa had – ketahui lebih di sini.
I'm an intraday futures trader, without necessarily having any particular talent. I show my trades in real time explaining the reasons behind them, the technological tools I use, the trading models I've developed, and my risk management best practices.
Penafian
Maklumat dan penerbitan adalah tidak bertujuan, dan tidak membentuk, nasihat atau cadangan kewangan, pelaburan, dagangan atau jenis lain yang diberikan atau disahkan oleh TradingView. Baca lebih dalam Terma Penggunaan.
Skrip dilindungi
Skrip ini diterbitkan sebagai sumber tertutup. Akan tetapi, anda boleh menggunakannya secara bebas dan tanpa apa-apa had – ketahui lebih di sini.
I'm an intraday futures trader, without necessarily having any particular talent. I show my trades in real time explaining the reasons behind them, the technological tools I use, the trading models I've developed, and my risk management best practices.
Penafian
Maklumat dan penerbitan adalah tidak bertujuan, dan tidak membentuk, nasihat atau cadangan kewangan, pelaburan, dagangan atau jenis lain yang diberikan atau disahkan oleh TradingView. Baca lebih dalam Terma Penggunaan.