OPEN-SOURCE SCRIPT
Custom Support & Resistance Levels (Manual Input)
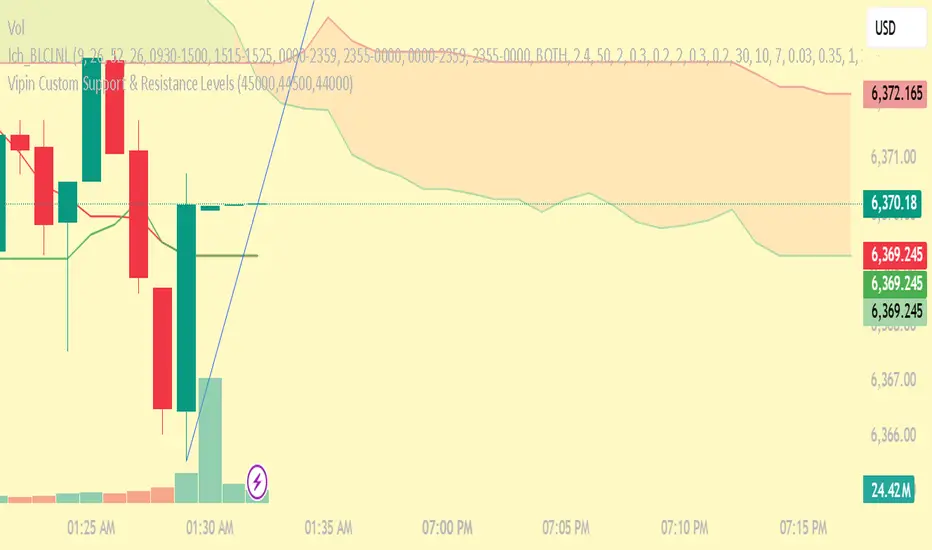
This indicator lets you plot your own support levels (and can be extended for resistance) directly on the chart by entering them as comma-separated values.
📌 Supports manual input for multiple price levels.
📊 Lines are extended across the chart for clear visualization.
🎨 Dynamic coloring:
Green if the current price is above the level.
Red if the current price is below the level.
🧹 Old lines are automatically cleared to avoid clutter.
This tool is ideal if you:
Prefer to mark your own key zones instead of relying only on auto-detected levels.
Want clean and simple visualization of critical price areas.
👉 Coming soon: Resistance levels input (commented in the code, can be enabled).
Skrip sumber terbuka
Dalam semangat TradingView sebenar, pencipta skrip ini telah menjadikannya sumber terbuka, jadi pedagang boleh menilai dan mengesahkan kefungsiannya. Terima kasih kepada penulis! Walaupuan anda boleh menggunakan secara percuma, ingat bahawa penerbitan semula kod ini tertakluk kepada Peraturan Dalaman.
Penafian
Maklumat dan penerbitan adalah tidak bertujuan, dan tidak membentuk, nasihat atau cadangan kewangan, pelaburan, dagangan atau jenis lain yang diberikan atau disahkan oleh TradingView. Baca lebih dalam Terma Penggunaan.