PROTECTED SOURCE SCRIPT
Telah dikemas kini Correlation Matrix
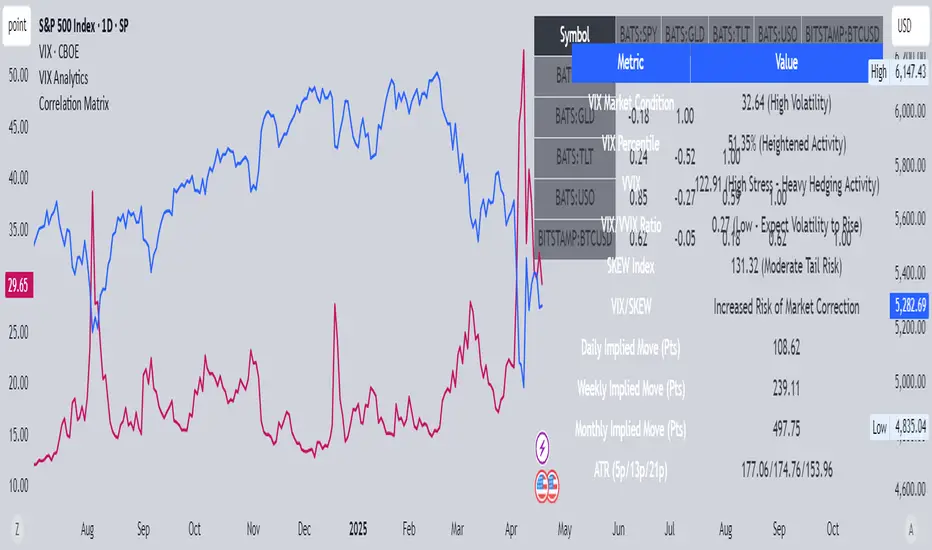
This indicator displays a real-time correlation matrix of any five assets selected by the user. It helps traders and investors identify relationships between different instruments—whether they move together (positive correlation), in opposite directions (negative correlation), or not at all (neutral).
Nota Keluaran
OverviewThe Correlation Matrix (Lower Triangle Only) is a powerful visualization tool that helps traders and analysts quickly assess the statistical relationship between multiple assets. This script calculates and displays Pearson correlation coefficients between five user-defined symbols over a specified time period and resolution.
Instead of cluttering the chart with redundant data, this matrix only shows the lower triangle of the correlation table. This allows you to focus on unique symbol pairings, improving readability and clarity.
Features
Five Customizable Symbols
The matrix is fully customizable. You can input any five symbols via the settings panel.
Examples: Compare ETFs like SPY, GLD, TLT, USO, and BTCUSD, or swap them for stocks, indices, crypto, or forex pairs.
Adjustable Timeframe & Length
Choose your desired timeframe (e.g., Daily, Weekly, Hourly) for correlation calculation.
Set the lookback period (default is 21 bars) to tune the sensitivity and granularity of the data.
Lower Triangle Design (No Redundancy)
Only unique correlations are shown below the diagonal.
The diagonal cells show a value of 1.00, representing perfect correlation of each symbol with itself.
The upper triangle is intentionally left blank to avoid duplicate entries.
Clean Table Format
Correlations are displayed in a neatly aligned matrix using the table feature.
Row and column headers automatically display the selected symbol names.
How to Use
Add the script to your chart.
Open the settings panel (gear icon) to:
Enter any five symbols (tickers).
Choose a timeframe (e.g., "D", "W", "60").
Set the correlation length (number of bars to compare).
The correlation matrix will appear in the top-right corner of your chart.
Each cell below the diagonal shows the Pearson correlation coefficient between the corresponding pair of assets:
+1.00: Perfect positive correlation
-1.00: Perfect negative (inverse) correlation
0.00: No correlation
Practical Applications
Identify asset diversification opportunities (e.g., choosing low-correlation assets).
Spot strongly correlated pairs for pairs trading strategies.
Monitor how intermarket relationships evolve over time (e.g., stocks vs. gold, bonds, or crypto).
Use in portfolio risk management and hedging strategies.
Tips
A longer lookback period (e.g., 60 or 90 bars) will smooth the correlations, while a shorter one (e.g., 10–21 bars) reveals more dynamic relationships.
You can update symbols on-the-fly to run ad hoc comparative analysis across sectors or asset classes.
Skrip dilindungi
Skrip ini diterbitkan sebagai sumber tertutup. Akan tetapi, anda boleh menggunakannya secara bebas dan tanpa apa-apa had – ketahui lebih di sini.
Penafian
Maklumat dan penerbitan adalah tidak bertujuan, dan tidak membentuk, nasihat atau cadangan kewangan, pelaburan, dagangan atau jenis lain yang diberikan atau disahkan oleh TradingView. Baca lebih dalam Terma Penggunaan.