OPEN-SOURCE SCRIPT
Midpoint of Last 3 Candles
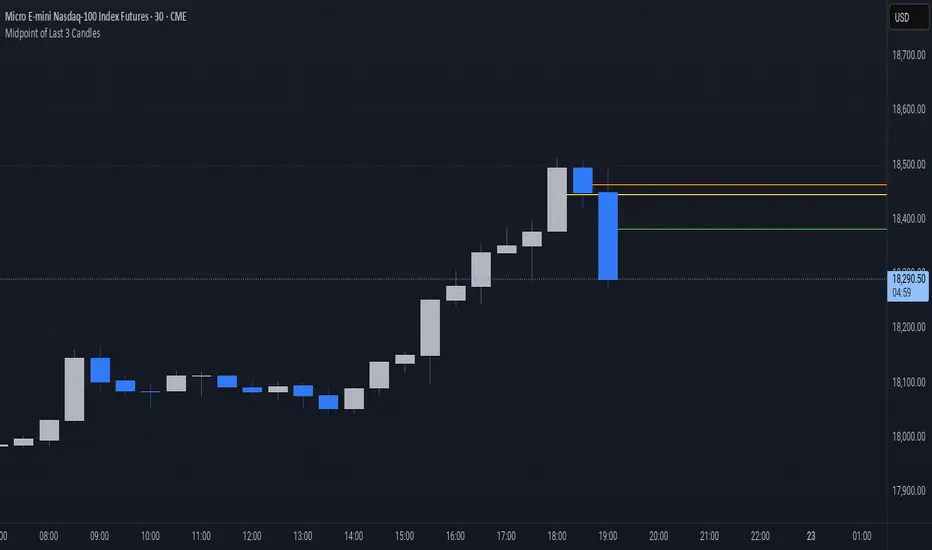
This indicator highlights the market structure by plotting the midpoints of the current and previous two candles. It draws a horizontal line at the average of the high and low for each of these candles, giving a visual cue of the short-term balance point in price action. These midpoints can act as dynamic support and resistance levels, helping traders assess areas of potential reaction or continuation.
Each line is color-coded for clarity: green represents the current candle, orange marks the previous candle, and yellow indicates the one before that. All lines extend into the future on the chart, allowing you to see how price interacts with these levels as new candles form. This simple yet effective tool can be useful in various strategies, especially those focused on price action, scalping, or intraday analysis.
Each line is color-coded for clarity: green represents the current candle, orange marks the previous candle, and yellow indicates the one before that. All lines extend into the future on the chart, allowing you to see how price interacts with these levels as new candles form. This simple yet effective tool can be useful in various strategies, especially those focused on price action, scalping, or intraday analysis.
Skrip sumber terbuka
In true TradingView spirit, the creator of this script has made it open-source, so that traders can review and verify its functionality. Kudos to the author! While you can use it for free, remember that republishing the code is subject to our House Rules.
Penafian
The information and publications are not meant to be, and do not constitute, financial, investment, trading, or other types of advice or recommendations supplied or endorsed by TradingView. Read more in the Terms of Use.