PROTECTED SOURCE SCRIPT
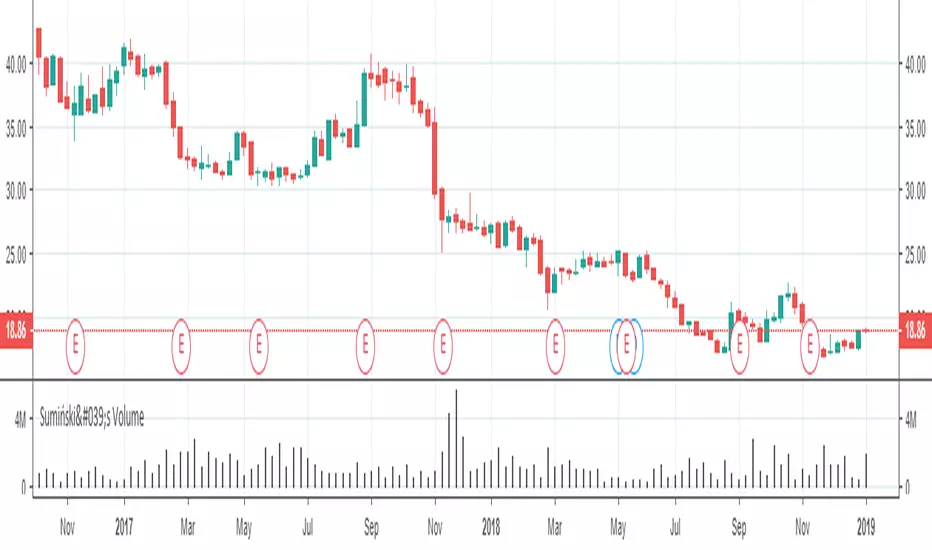
Sumiński's Volume

Hello, this indicator shows us the trading activity in the selected time period. It's similar to the tick volume, the difference being that this indicator is based on real volume. It measures the average amount of volume per 1 pips price in the selected time period. It is useful when after the end of the trend the price comes into consolidation, if at the levels close to support or resistance the indicator shows a high value - it means that there is an intense exchange of contracts or shares - which means that this price level is considered by the market as important.
Sorry for my English and good luck in the markets.
Sorry for my English and good luck in the markets.
Skrip dilindungi
Skrip ini diterbitkan sebagai sumber tertutup. Akan tetapi, anda boleh menggunakannya secara bebas dan tanpa apa-apa had – ketahui lebih di sini.
Penafian
Maklumat dan penerbitan adalah tidak bertujuan, dan tidak membentuk, nasihat atau cadangan kewangan, pelaburan, dagangan atau jenis lain yang diberikan atau disahkan oleh TradingView. Baca lebih dalam Terma Penggunaan.