OPEN-SOURCE SCRIPT
Telah dikemas kini Key Levels by MoneyTribe21
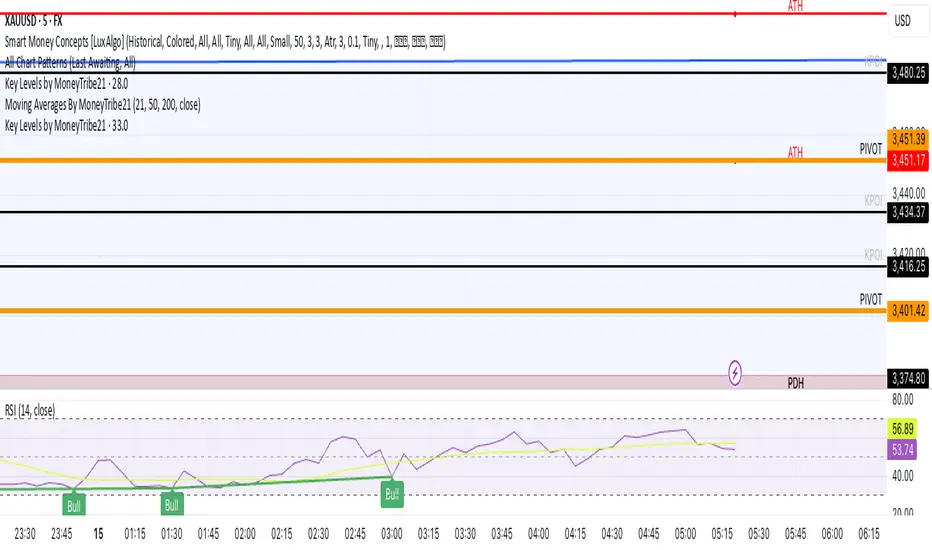
This custom script provides real-time tracking of key market price levels, helping traders identify critical support and resistance zones. It dynamically updates throughout the trading session, making it ideal for intraday trading, breakout strategies, and market structure analysis.
Features:
Real-Time Tracking of Key Price Levels:
ATH (All-Time High): Tracks the highest price ever reached for the asset.
PDH (Previous Day High): Marks the high of the last trading day,
PDL (Previous Day Low): Marks the low of the last trading day, serving as dynamic support.
Resistance Level: Based on the current day’s high, signaling potential price rejection points.
Support Level: Based on the current day’s low, indicating potential price bounces.
Daily Open Price: Tracks the exact market open price at the start of the trading session.
Works Across All Timeframes:
Designed for intraday, swing, and long-term trading.
Automatically adjusts levels for Forex, Stocks, Crypto, and Indices.
Fully Customizable Settings:
Modify line colors, thickness, and styles for better chart readability.
Enable/disable specific levels based on trading preference.
Works on all TradingView-compatible brokers and platforms.
How to Use This Indicator:
Breakout & Reversal Trading:
If price breaks above PDH, it may indicate bullish momentum.
If price breaks below PDL, it may signal a bearish continuation.
ATH levels can act as strong resistance zones—watch for breakouts or rejection.
Dynamic Support & Resistance:
Resistance Level (Current Day High): If price fails to break, it may signal a reversal.
Support Level (Current Day Low): If price bounces off, it may confirm a strong uptrend.
Daily Open for Trend Confirmation:
Above Daily Open: Market sentiment is bullish.
Below Daily Open: Market sentiment is bearish.
Customization Options:
Toggle individual price levels ON/OFF for a clutter-free chart.
Customize colors, line styles, and alerts for better visualization.
Set alerts for breakouts & retests of key levels.
Ideal for Traders Who:
Want high-probability support & resistance zones in real-time.
Trade breakouts, reversals, or trend continuations.
Use market structure analysis for informed decision-making.
Need automatic price tracking instead of drawing levels manually.
Compatible with all TradingView timeframes & assets (Forex, Stocks, Crypto, Indices).
Designed for both beginner and advanced traders.
Add this indicator to your chart and start tracking key levels instantly.
Nota Keluaran
Fixed the ATH tracking on lower time frames based on historical bars using the higher time frames as a reference Nota Keluaran
Tracking the ATH of monthly time frameSkrip sumber terbuka
Dalam semangat TradingView sebenar, pencipta skrip ini telah menjadikannya sumber terbuka, jadi pedagang boleh menilai dan mengesahkan kefungsiannya. Terima kasih kepada penulis! Walaupuan anda boleh menggunakan secara percuma, ingat bahawa penerbitan semula kod ini tertakluk kepada Peraturan Dalaman.
Penafian
Maklumat dan penerbitan adalah tidak bertujuan, dan tidak membentuk, nasihat atau cadangan kewangan, pelaburan, dagangan atau jenis lain yang diberikan atau disahkan oleh TradingView. Baca lebih dalam Terma Penggunaan.
Skrip sumber terbuka
Dalam semangat TradingView sebenar, pencipta skrip ini telah menjadikannya sumber terbuka, jadi pedagang boleh menilai dan mengesahkan kefungsiannya. Terima kasih kepada penulis! Walaupuan anda boleh menggunakan secara percuma, ingat bahawa penerbitan semula kod ini tertakluk kepada Peraturan Dalaman.
Penafian
Maklumat dan penerbitan adalah tidak bertujuan, dan tidak membentuk, nasihat atau cadangan kewangan, pelaburan, dagangan atau jenis lain yang diberikan atau disahkan oleh TradingView. Baca lebih dalam Terma Penggunaan.