OPEN-SOURCE SCRIPT
Gold Correlation Dashboard + Alerts [XAUUSD Helper]
這是一個專為黃金 (XAUUSD) 交易者設計的 **跨市分析儀表板 (Intermarket Correlation Dashboard)**。
這個指標的核心邏輯基於基本面與資金流向,協助交易者在 10 秒內快速判斷黃金的當前趨勢。它自動監控與黃金高度負相關的資產(美元、美債、日圓),並在圖表上直接顯示多空傾向。
### 📊 監控資產與邏輯
本腳本即時抓取以下關鍵市場數據,並分析其對黃金的影響:
1. **DXY (美元指數)**:黃金最大競爭對手。
- DXY 跌 📉 → 黃金偏多
- DXY 漲 📈 → 黃金偏空
2. **US10Y (10年期美債殖利率)**:黃金的持有成本指標。
- 殖利率跌 📉 → 黃金偏多
- 殖利率漲 📈 → 黃金偏空
3. **USDJPY (美日)** & **USDCHF (美瑞)**:避險資金流向參考。
- 匯率跌 (日圓/瑞郎強) 📉 → 黃金偏多
4. **VIX (恐慌指數)**:市場情緒指標。
- VIX 飆升 📈 → 黃金通常受惠 (避險屬性)
### 🚀 主要功能
1. **即時儀表板**:無需切換視窗,直接在黃金圖表角落查看所有關鍵資產的漲跌狀態。
2. **智能信號總結**:
- 系統會自動計算 **DXY + US10Y + USDJPY** 的綜合方向。
- 當這三大核心指標方向一致時,系統會顯示 **★ STRONG BUY (強力做多)** 或 **★ STRONG SELL (強力做空)**。
- 根據歷史經驗,當這三者同步時,趨勢準確度極高。
3. **警報系統 (Alerts)**:
- 內建警報功能,當出現「強力做多」或「強力做空」信號時,可設定推播通知,不錯過進場機會。
### ⚙️ 如何使用
- 將此指標加載到 XAUUSD (黃金) 的圖表上。
- 建議搭配 H1, H4 或 Daily 時框使用。
- **綠色背景** = 利多黃金 (Bullish)
- **紅色背景** = 利空黃金 (Bearish)
---
*免責聲明:此腳本僅供輔助分析與教育用途,不構成任何投資建議。交易請做好風險控管。*
**Gold (XAUUSD) Intermarket Correlation Dashboard & Alerts**
This indicator is designed for Gold traders who want to combine Technical Analysis with **Fundamental Intermarket Analysis**. It provides a real-time dashboard overlay that monitors key assets highly correlated with XAUUSD.
According to market logic, Gold is heavily influenced by the US Dollar (DXY), US Treasury Yields (US10Y), and global risk sentiment (USDJPY/VIX). This script helps you spot the trend in seconds.
### 📊 Monitored Assets & Logic
The dashboard tracks the real-time direction of the following assets and calculates their impact on Gold:
1. **DXY (US Dollar Index)**: Inverse correlation.
* DXY ↓ = Bullish for Gold
* DXY ↑ = Bearish for Gold
2. **US10Y (US 10-Year Treasury Yield)**: Inverse correlation (Cost of Holding).
* Yields ↓ = Bullish for Gold
* Yields ↑ = Bearish for Gold
3. **USDJPY & USDCHF**: Risk sentiment and currency flow.
* Pair ↓ (Strong JPY/CHF) = Bullish for Gold
4. **VIX (Volatility Index)**: Fear gauge.
* VIX ↑ = Generally Bullish for Gold (Safe Haven demand)
### 🚀 Key Features
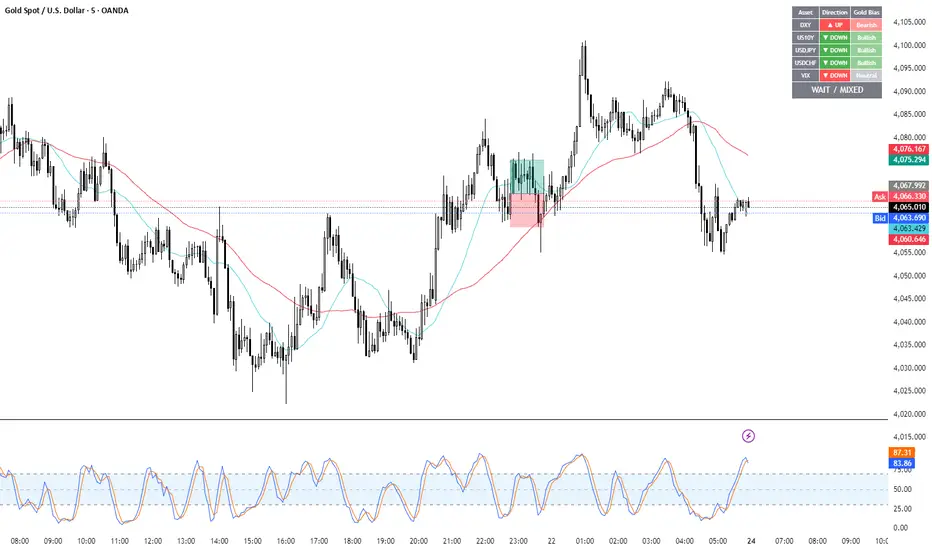
**1. Real-Time Dashboard**
View the status of all 5 key assets directly on your XAUUSD chart without switching tabs. The dashboard indicates the "Gold Bias" (Bullish/Bearish) for each asset based on the current timeframe.
**2. Smart Bias Signal ("The 3-Storyline Confirmation")**
The script automatically analyzes the three most critical indicators: **DXY, US10Y, and USDJPY**.
* **★ STRONG BUY ★**: When DXY, US10Y, and USDJPY are **ALL Falling** simultaneously. (High probability setup).
* **★ STRONG SELL ★**: When DXY, US10Y, and USDJPY are **ALL Rising** simultaneously.
**3. Integrated Alerts**
Never miss a setup. You can set alerts to notify you immediately when the "Strong Buy" or "Strong Sell" conditions are met.
### ⚙️ How to Use
1. Add this script to your XAUUSD chart.
2. Works best on H1, H4, or Daily timeframes.
3. Look for the **Summary Row** at the bottom of the dashboard:
* **Green (Strong Buy)**: Look for Long entries.
* **Red (Strong Sell)**: Look for Short entries.
---
*Disclaimer: This script is for educational and informational purposes only. It does not constitute financial advice. Always manage your risk.*
這個指標的核心邏輯基於基本面與資金流向,協助交易者在 10 秒內快速判斷黃金的當前趨勢。它自動監控與黃金高度負相關的資產(美元、美債、日圓),並在圖表上直接顯示多空傾向。
### 📊 監控資產與邏輯
本腳本即時抓取以下關鍵市場數據,並分析其對黃金的影響:
1. **DXY (美元指數)**:黃金最大競爭對手。
- DXY 跌 📉 → 黃金偏多
- DXY 漲 📈 → 黃金偏空
2. **US10Y (10年期美債殖利率)**:黃金的持有成本指標。
- 殖利率跌 📉 → 黃金偏多
- 殖利率漲 📈 → 黃金偏空
3. **USDJPY (美日)** & **USDCHF (美瑞)**:避險資金流向參考。
- 匯率跌 (日圓/瑞郎強) 📉 → 黃金偏多
4. **VIX (恐慌指數)**:市場情緒指標。
- VIX 飆升 📈 → 黃金通常受惠 (避險屬性)
### 🚀 主要功能
1. **即時儀表板**:無需切換視窗,直接在黃金圖表角落查看所有關鍵資產的漲跌狀態。
2. **智能信號總結**:
- 系統會自動計算 **DXY + US10Y + USDJPY** 的綜合方向。
- 當這三大核心指標方向一致時,系統會顯示 **★ STRONG BUY (強力做多)** 或 **★ STRONG SELL (強力做空)**。
- 根據歷史經驗,當這三者同步時,趨勢準確度極高。
3. **警報系統 (Alerts)**:
- 內建警報功能,當出現「強力做多」或「強力做空」信號時,可設定推播通知,不錯過進場機會。
### ⚙️ 如何使用
- 將此指標加載到 XAUUSD (黃金) 的圖表上。
- 建議搭配 H1, H4 或 Daily 時框使用。
- **綠色背景** = 利多黃金 (Bullish)
- **紅色背景** = 利空黃金 (Bearish)
---
*免責聲明:此腳本僅供輔助分析與教育用途,不構成任何投資建議。交易請做好風險控管。*
**Gold (XAUUSD) Intermarket Correlation Dashboard & Alerts**
This indicator is designed for Gold traders who want to combine Technical Analysis with **Fundamental Intermarket Analysis**. It provides a real-time dashboard overlay that monitors key assets highly correlated with XAUUSD.
According to market logic, Gold is heavily influenced by the US Dollar (DXY), US Treasury Yields (US10Y), and global risk sentiment (USDJPY/VIX). This script helps you spot the trend in seconds.
### 📊 Monitored Assets & Logic
The dashboard tracks the real-time direction of the following assets and calculates their impact on Gold:
1. **DXY (US Dollar Index)**: Inverse correlation.
* DXY ↓ = Bullish for Gold
* DXY ↑ = Bearish for Gold
2. **US10Y (US 10-Year Treasury Yield)**: Inverse correlation (Cost of Holding).
* Yields ↓ = Bullish for Gold
* Yields ↑ = Bearish for Gold
3. **USDJPY & USDCHF**: Risk sentiment and currency flow.
* Pair ↓ (Strong JPY/CHF) = Bullish for Gold
4. **VIX (Volatility Index)**: Fear gauge.
* VIX ↑ = Generally Bullish for Gold (Safe Haven demand)
### 🚀 Key Features
**1. Real-Time Dashboard**
View the status of all 5 key assets directly on your XAUUSD chart without switching tabs. The dashboard indicates the "Gold Bias" (Bullish/Bearish) for each asset based on the current timeframe.
**2. Smart Bias Signal ("The 3-Storyline Confirmation")**
The script automatically analyzes the three most critical indicators: **DXY, US10Y, and USDJPY**.
* **★ STRONG BUY ★**: When DXY, US10Y, and USDJPY are **ALL Falling** simultaneously. (High probability setup).
* **★ STRONG SELL ★**: When DXY, US10Y, and USDJPY are **ALL Rising** simultaneously.
**3. Integrated Alerts**
Never miss a setup. You can set alerts to notify you immediately when the "Strong Buy" or "Strong Sell" conditions are met.
### ⚙️ How to Use
1. Add this script to your XAUUSD chart.
2. Works best on H1, H4, or Daily timeframes.
3. Look for the **Summary Row** at the bottom of the dashboard:
* **Green (Strong Buy)**: Look for Long entries.
* **Red (Strong Sell)**: Look for Short entries.
---
*Disclaimer: This script is for educational and informational purposes only. It does not constitute financial advice. Always manage your risk.*
Skrip sumber terbuka
Dalam semangat TradingView sebenar, pencipta skrip ini telah menjadikannya sumber terbuka, jadi pedagang boleh menilai dan mengesahkan kefungsiannya. Terima kasih kepada penulis! Walaupuan anda boleh menggunakan secara percuma, ingat bahawa penerbitan semula kod ini tertakluk kepada Peraturan Dalaman.
Penafian
Maklumat dan penerbitan adalah tidak bertujuan, dan tidak membentuk, nasihat atau cadangan kewangan, pelaburan, dagangan atau jenis lain yang diberikan atau disahkan oleh TradingView. Baca lebih dalam Terma Penggunaan.