PROTECTED SOURCE SCRIPT
Khate ravand

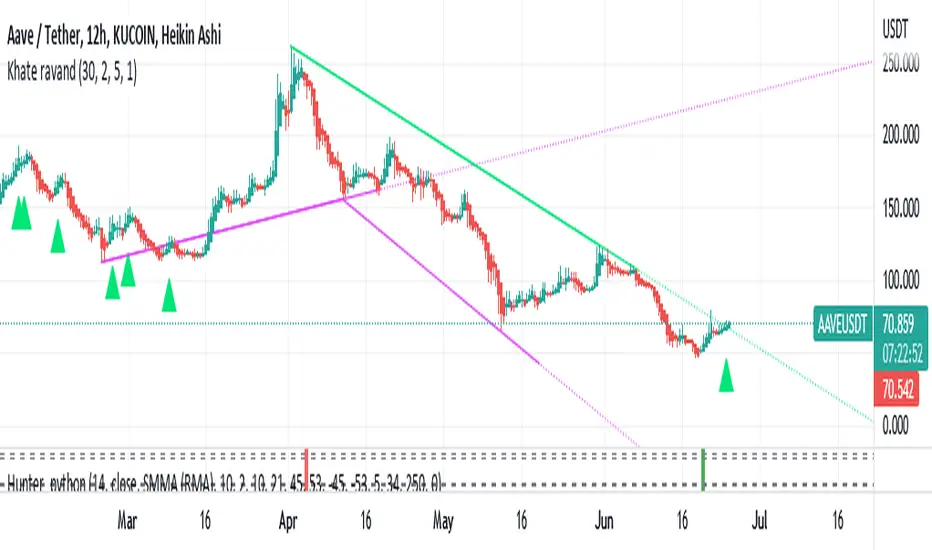
This script draws trendlines from the pivot points in the price chart.
//
// The input for the function that draws the trendlines is any calculation or function
// (here this is pivot points, but the core of the script can be used in other implementations too),
// that most of the time and occasionally produces a 'non n/a' value.
// The trendline function then connects the non n/a values and extends the connections of those points in a trendline.
//
// There is an option to draw the lines from the wicks or from the 'real bodies' of the candles.
// The trendlines can either extend infinitely or only run for an adjustable amount of bars.
//
// There's an option to display trendline breaks
// And the option to display trendlines in color or monochrome
//
//
// The input for the function that draws the trendlines is any calculation or function
// (here this is pivot points, but the core of the script can be used in other implementations too),
// that most of the time and occasionally produces a 'non n/a' value.
// The trendline function then connects the non n/a values and extends the connections of those points in a trendline.
//
// There is an option to draw the lines from the wicks or from the 'real bodies' of the candles.
// The trendlines can either extend infinitely or only run for an adjustable amount of bars.
//
// There's an option to display trendline breaks
// And the option to display trendlines in color or monochrome
//
Skrip dilindungi
Skrip ini diterbitkan sebagai sumber tertutup. Akan tetapi, anda boleh menggunakannya secara bebas dan tanpa apa-apa had – ketahui lebih di sini.
Penafian
Maklumat dan penerbitan adalah tidak bertujuan, dan tidak membentuk, nasihat atau cadangan kewangan, pelaburan, dagangan atau jenis lain yang diberikan atau disahkan oleh TradingView. Baca lebih dalam Terma Penggunaan.