OPEN-SOURCE SCRIPT
Telah dikemas kini [blackcat] L1 Swing Reversal Oscillator
█ OVERVIEW
The script defines a custom indicator called the "L1 Swing Reversal Oscillator," which integrates moving averages and RSI to detect possible swing reversals in market trends. Its core purpose is to produce signals derived from the oscillator's indications of overbought or oversold states.
█ LOGICAL FRAMEWORK
The script comprises multiple key segments:
1 — Custom Functions: Encompasses calculate_weighted_moving_average and calculate_l1_swing_reversal_oscillator.
2 — Input Parameters: Permits customization of moving average lengths and weights alongside RSI settings.
3 — Calculations: Employs predefined functions to determine oscillator readings.
4 — Plot Statements: Depicts oscillator outputs graphically on the chart.
Data processing follows this sequence: initial computation of the typical price, subsequent derivation of the adjusted CC1 metric, additional smoothing operations, and finally, RSI evaluation prior to plotting the resultant oscillator figures.
█ CUSTOM FUNCTIONS
• calculate_weighted_moving_average(source, length, weight): Generates a weighted moving average from the provided source material utilizing specified duration and coefficient inputs.
– Returns computed weighted moving average.
• calculate_l1_swing_reversal_oscillator(close_price, high_price, low_price, sma_length, sma_weight, rsi_length): Assesses the L1 Swing Reversal Oscillator leveraging closing, highest, and lowest prices along with defined SMA span, weighting factor, and RSI period.
– Yields an array featuring central CC1, CB1, CB2, and RSI metrics.
█ KEY POINTS AND TECHNIQUES
• Weighted Moving Average: Incorporates bespoke functionality for computing weighted moving averages, distinct from built-in Pine Script methods.
• RSI Calculation: Employs customized logic for calculating Relative Strength Index, offering adaptable computational approaches.
• Plotting Techniques: Implements color coding contingent upon oscillator values to emphasize visual cues regarding overbought and oversold statuses.
• Optimization: Furnishes adjustable parameters including SMA timeframe, weightage, and RSI interval enabling personalized fine-tuning per user requirements.
█ EXTENDED KNOWLEDGE AND APPLICATIONS
• Modifications: Potential enhancements involve integrating supplementary oscillators like MACD or Stochastic Oscillator alongside the existing L1 Swing Reversal Oscillator.
• Application Scenarios: Comparable methodologies can be adopted within various trading frameworks focusing on momentum shifts such as trend-following or mean reversion tactics.
• Related Concepts: Proficiency in crafting custom functions, manipulating moving averages, and interpreting RSI within Pine Script environment proves advantageous when altering or expanding on current script functionalities. Understanding utilization of nz and na functions for managing null data points adds significant depth.
Nota Keluaran
Add bannerNota Keluaran
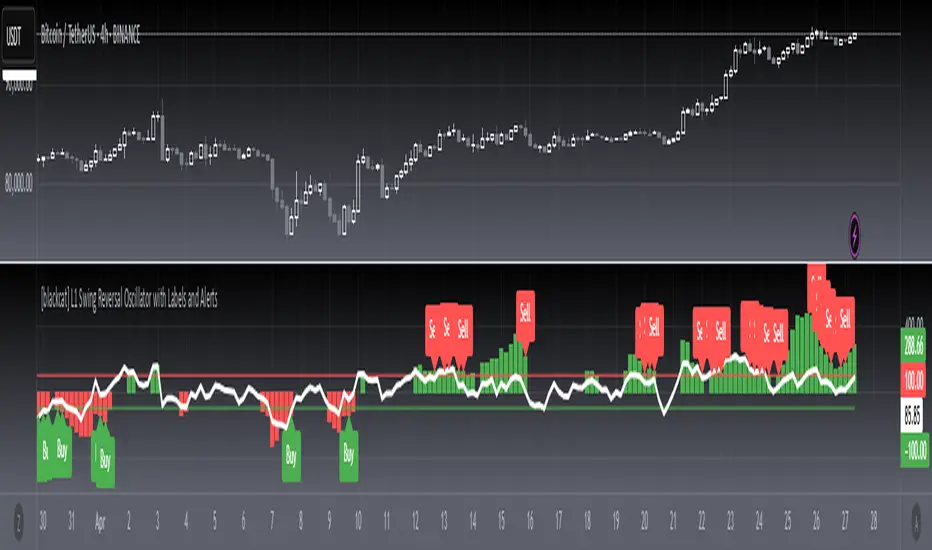
OVERVIEWThe L1 Swing Reversal Oscillator provides a comprehensive analysis of price action and momentum using weighted moving averages and RSI calculations. It identifies potential reversal points through a combination of technical indicators and visual alerts.
FEATURES
• Custom Weighted Moving Average
• Centered CC1 Calculation
• Three-Tier C1, C2, C3 Analysis
• RSI Integration
• Buy/Sell Signal Generation
• Visual Label Alerts
HOW TO USE
Configure the following parameters:
SMA Length (default: 9)
SMA Weight (default: 14)
RSI Length (default: 6)
Monitor the indicator plots:
Centered CC1 Oscillator: Shows price momentum
RSI Line: Indicates market strength
Buy/Sell Labels: Visual alerts for trading opportunities
Look for:
Green columns: Bullish momentum
Red columns: Bearish momentum
Labels: Confirmed buy/sell signals
TECHNICAL DETAILS
• Oscillator Components:
Typical Price Calculation
Centered CC1 Normalization
Multiple Moving Average Layers
RSI Momentum Analysis
• Signal Generation Logic:
Buy Signals: CC1 < -100, CB1 > CB2, RSI < 0
Sell Signals: CC1 > 100, CB1 < CB2, RSI > 0
PARAMETERS
• Customizable Settings:
SMA Length: Controls the lookback period
SMA Weight: Affects the weight of recent prices
RSI Length: Determines RSI calculation period
LIMITATIONS
• May generate false signals during choppy markets
• Requires proper parameter tuning for optimal performance
• Best used in trending conditions
NOTES
• Indicator works best on daily or higher timeframes
• Consider combining with other technical analysis tools
• Labels provide clear visual confirmation of signals
THANKS
Special thanks to the TradingView community for their contributions and feedback.
Skrip sumber terbuka
Dalam semangat TradingView sebenar, pencipta skrip ini telah menjadikannya sumber terbuka, jadi pedagang boleh menilai dan mengesahkan kefungsiannya. Terima kasih kepada penulis! Walaupuan anda boleh menggunakan secara percuma, ingat bahawa penerbitan semula kod ini tertakluk kepada Peraturan Dalaman.
Avoid losing contact!Don't miss out! The first and most important thing to do is to join my Discord chat now! Click here to start your adventure: discord.com/invite/ZTGpQJq 防止失联,请立即行动,加入本猫聊天群: discord.com/invite/ZTGpQJq
Penafian
Maklumat dan penerbitan adalah tidak bertujuan, dan tidak membentuk, nasihat atau cadangan kewangan, pelaburan, dagangan atau jenis lain yang diberikan atau disahkan oleh TradingView. Baca lebih dalam Terma Penggunaan.