OPEN-SOURCE SCRIPT
Momentum Charge Theory (MCT)-(TechnoBlooms)
The Momentum Charge Theory (MCT) Indicator is an advanced physics and mathematics-inspired trend detection system designed to identify market energy shifts with precision. Unlike traditional indicators that rely on static formulas, MCT integrates entropy, volatility, kinetic energy, and wavelet transforms to map price dynamics in real time.
Built on Scientific Principles – This indicator applies quantum-inspired charge-discharge mechanics to spot early trend formations and reversals. Think of price action like an energy system: it charges (builds momentum) before an explosive move and discharges when that energy dissipates.
Core Concepts Behind MCT
1️⃣ Directional Market Entropy – Measuring Trend Strength
Entropy quantifies market randomness – is the trend structured or chaotic?
✅ A high-entropy market is uncertain (choppy price action), while a low-entropy market signals a strong directional trend.
✅ MCT normalizes entropy, allowing traders to differentiate trend acceleration from market noise.
2️⃣ Information Flow Volatility – Identifying Breakout Zones
Inspired by Econophysics, this component measures volatility based on information flow rather than simple price movements.
✅ Helps spot high-volatility breakout conditions before they occur.
✅ Filters out false breakouts caused by random market noise.
3️⃣ Kinetic Energy Momentum (KEM) – The Physics of Price Acceleration
Just like in physics, momentum is a function of mass and velocity – in trading, this translates to volume and price change.
✅ Uses kinetic energy equations to identify price acceleration zones.
✅ Helps detect momentum shifts before price visibly reacts.
4️⃣ Hilbert Transform Approximation – Slope & Trend Direction Analysis
Applies Hilbert Transforms to estimate trend angle shifts.
✅ Detects momentum decay and early reversal signals.
✅ Captures the true trend slope rather than relying on lagging moving averages.
5️⃣ Wavelet Transform – Advanced Noise Filtering & Trend Confirmation
Market movements contain multiple frequencies – wavelet transforms isolate dominant trends while removing short-term price noise.
✅ Improves trend clarity by reducing false signals.
✅ Acts as a final confirmation filter before generating Charge & Discharge signals.
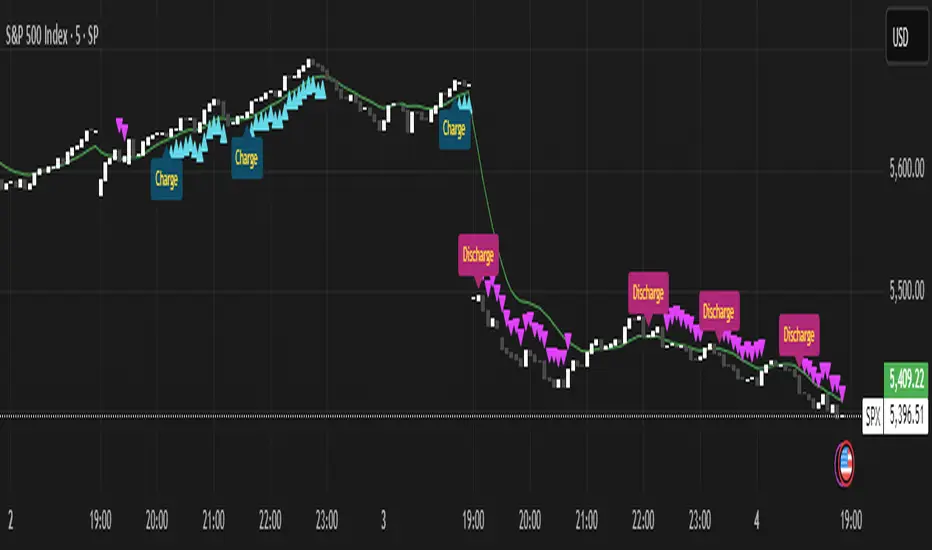
Charge & Discharge – The Energy Behind Market Moves
🔹 Charge (Uptrend Activation)
A blue triangle appears below the candle when market conditions align for a strong bullish move.
📈 Indicates momentum buildup, low entropy, and trend strength confirmation.

🔸 Discharge (Downtrend Activation)
A purple triangle appears above the candle when price momentum weakens and market entropy increases.
📉 Suggests a potential trend exhaustion or reversal.

Best Use Cases for Traders
✅ Momentum Traders – Catch trend initiations before they gain full traction.
✅ Breakout Traders – Identify high-information flow zones with volatility-driven signals.
✅ Trend Followers – Avoid false signals by relying on entropy-driven confirmations.
The MCT indicator can be combined with any of your usual indicators for trend confirmation.
Built on Scientific Principles – This indicator applies quantum-inspired charge-discharge mechanics to spot early trend formations and reversals. Think of price action like an energy system: it charges (builds momentum) before an explosive move and discharges when that energy dissipates.
Core Concepts Behind MCT
1️⃣ Directional Market Entropy – Measuring Trend Strength
Entropy quantifies market randomness – is the trend structured or chaotic?
✅ A high-entropy market is uncertain (choppy price action), while a low-entropy market signals a strong directional trend.
✅ MCT normalizes entropy, allowing traders to differentiate trend acceleration from market noise.
2️⃣ Information Flow Volatility – Identifying Breakout Zones
Inspired by Econophysics, this component measures volatility based on information flow rather than simple price movements.
✅ Helps spot high-volatility breakout conditions before they occur.
✅ Filters out false breakouts caused by random market noise.
3️⃣ Kinetic Energy Momentum (KEM) – The Physics of Price Acceleration
Just like in physics, momentum is a function of mass and velocity – in trading, this translates to volume and price change.
✅ Uses kinetic energy equations to identify price acceleration zones.
✅ Helps detect momentum shifts before price visibly reacts.
4️⃣ Hilbert Transform Approximation – Slope & Trend Direction Analysis
Applies Hilbert Transforms to estimate trend angle shifts.
✅ Detects momentum decay and early reversal signals.
✅ Captures the true trend slope rather than relying on lagging moving averages.
5️⃣ Wavelet Transform – Advanced Noise Filtering & Trend Confirmation
Market movements contain multiple frequencies – wavelet transforms isolate dominant trends while removing short-term price noise.
✅ Improves trend clarity by reducing false signals.
✅ Acts as a final confirmation filter before generating Charge & Discharge signals.
Charge & Discharge – The Energy Behind Market Moves
🔹 Charge (Uptrend Activation)
A blue triangle appears below the candle when market conditions align for a strong bullish move.
📈 Indicates momentum buildup, low entropy, and trend strength confirmation.
🔸 Discharge (Downtrend Activation)
A purple triangle appears above the candle when price momentum weakens and market entropy increases.
📉 Suggests a potential trend exhaustion or reversal.
Best Use Cases for Traders
✅ Momentum Traders – Catch trend initiations before they gain full traction.
✅ Breakout Traders – Identify high-information flow zones with volatility-driven signals.
✅ Trend Followers – Avoid false signals by relying on entropy-driven confirmations.
The MCT indicator can be combined with any of your usual indicators for trend confirmation.
Skrip sumber terbuka
Dalam semangat TradingView sebenar, pencipta skrip ini telah menjadikannya sumber terbuka, jadi pedagang boleh menilai dan mengesahkan kefungsiannya. Terima kasih kepada penulis! Walaupuan anda boleh menggunakan secara percuma, ingat bahawa penerbitan semula kod ini tertakluk kepada Peraturan Dalaman.
Penafian
Maklumat dan penerbitan adalah tidak bertujuan, dan tidak membentuk, nasihat atau cadangan kewangan, pelaburan, dagangan atau jenis lain yang diberikan atau disahkan oleh TradingView. Baca lebih dalam Terma Penggunaan.