PROTECTED SOURCE SCRIPT
Trend Table MTF – Customizable PRO
Trend Table MTF – Customizable PRO
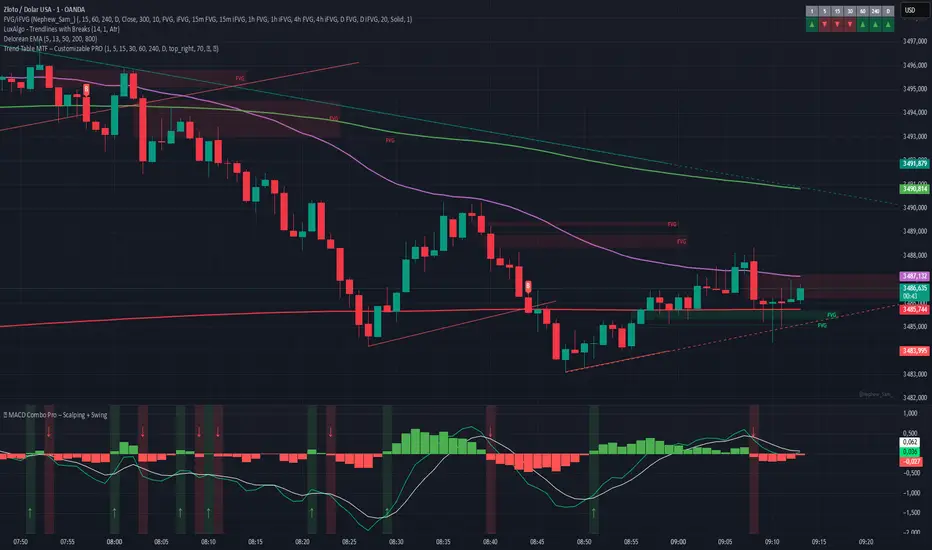
The Trend Table MTF – Customizable PRO is a powerful visual tool that helps traders instantly monitor multi-timeframe trend direction using a simple and clean table display.
Perfect for scalpers, intraday, and swing traders, this indicator offers a bird’s eye view of the market trend across multiple timeframes – all in a compact format.
🔍 Features:
✅ 7 Timeframes (fully customizable: 1m, 5m, 15m, 30m, 1h, 4h, 1D by default)
✅ Trend Detection via price vs EMA 20 (customizable logic possible)
✅ Custom Table Positioning (Top/Bottom, Left/Right)
✅ Adjustable Background Transparency
✅ Fully Customizable Colors:
Background
Text
Uptrend Arrow Color (▲)
Downtrend Arrow Color (▼)
Uptrend Background Color
Downtrend Background Color
✅ Arrow Symbols for quick trend recognition
✅ Works on any asset and timeframe
🎯 How It Works:
The indicator compares the current price to the 20-period EMA on each selected timeframe.
If Price > EMA, it's considered an Uptrend (▲).
If Price < EMA, it's a Downtrend (▼).
You get immediate color-coded visual feedback in the table with customizable arrows and background colors.
📊 Use Cases:
🔹 Confirm trend alignment before entering trades
🔹 Spot momentum shifts across timeframes
🔹 Combine with your scalping or swing strategy for extra confidence
🔹 Perfect companion to your price action or volume indicators
🧩 Pro Tips:
Combine this with MACD, RSI, or Liquidity Zones for powerful confluence
Use table transparency to avoid visual clutter on your chart
Choose high-contrast colors for quick glance recognition
Skrip dilindungi
Skrip ini diterbitkan sebagai sumber tertutup. Akan tetapi, anda boleh menggunakannya dengan percuma dan tanpa had – ketahui lebih lanjut di sini.
Penafian
Maklumat dan penerbitan adalah tidak dimaksudkan untuk menjadi, dan tidak membentuk, nasihat untuk kewangan, pelaburan, perdagangan dan jenis-jenis lain atau cadangan yang dibekalkan atau disahkan oleh TradingView. Baca dengan lebih lanjut di Terma Penggunaan.