OPEN-SOURCE SCRIPT
Telah dikemas kini Trend lines
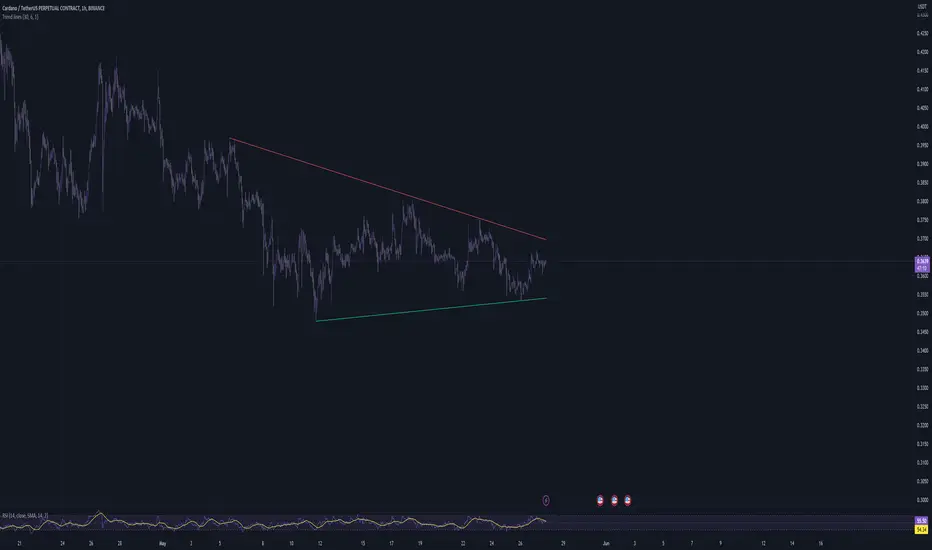
This script aims to identify and plot trend lines and pivot points on a price chart, with the aim of facilitating technical analysis for trading.
The script allows users to configure a number of parameters including the period for Pivot Points, the maximum number of pivots, and the maximum number of trend lines.
Pivot points (local highs and lows in the price data) are identified using TradingView's built-in pivot high and pivot low functions. The identified pivot points are then stored in arrays. The script also optionally plots these points on the chart.
The main goal of the script is to find and plot trend lines based on the pivot points. For each pair of pivot points, it computes the slope of the line connecting them. If all the other pivot points are below this line (for downward trends) or above this line (for upward trends), the line is considered a valid trend line.
The script also includes a feature that suggests potential "buy" or "sell" points along the trend lines. When the price touches the trend line, a label indicating a potential trading action (buy or sell) is created on the chart.
Nota Keluaran
fixed a problem where the line crosses the price and doesnt dissapear. Nota Keluaran
changed reference imageNota Keluaran
changes to make it a little bit fasterNota Keluaran
- removed signals because this indicator does not need them- updated logic
- added different colors for lines
Skrip sumber terbuka
Dalam semangat TradingView sebenar, pencipta skrip ini telah menjadikannya sumber terbuka, jadi pedagang boleh menilai dan mengesahkan kefungsiannya. Terima kasih kepada penulis! Walaupuan anda boleh menggunakan secara percuma, ingat bahawa penerbitan semula kod ini tertakluk kepada Peraturan Dalaman.
Penafian
Maklumat dan penerbitan adalah tidak bertujuan, dan tidak membentuk, nasihat atau cadangan kewangan, pelaburan, dagangan atau jenis lain yang diberikan atau disahkan oleh TradingView. Baca lebih dalam Terma Penggunaan.