OPEN-SOURCE SCRIPT
Telah dikemas kini Plot Level on Threshold Exceed
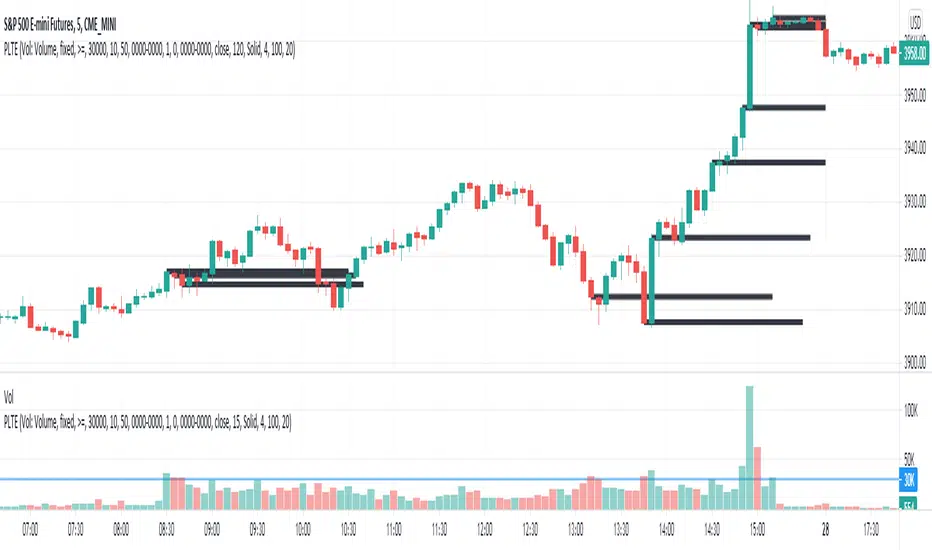
This script plots a line for X minutes, when the given reference source (which could be another indicator like volume, etc), exceeds the fixed value threshold.
There is a line limit in TV, so only the most recent 40 lines are plotted
There is a line limit in TV, so only the most recent 40 lines are plotted
Nota Keluaran
Added numerous other threshold types (sma, ema, wma, rma, swma, percentiles)Added custom comparator logic (<, <=, =, >, >=)
Added threshold multiplier
Added ability to plot threshold itself
Nota Keluaran
Added in sample session filter (only include samples during desired session times)Added in percentiles and stddev/ma thresholds
Added in efficiencies for line management
Added in plotshape functionality
Nota Keluaran
Threshold offset field added to prevent current bar influencing the threshold itself (if desired)Nota Keluaran
Updated with additional capabilities for plotarrow and plotcharNota Keluaran
Updated for cross-based comparatorsNota Keluaran
Updated arrow logic to be in line with threshold break direction, or alternatively select to reverse this logic.Skrip sumber terbuka
Dalam semangat TradingView sebenar, pencipta skrip ini telah menjadikannya sumber terbuka, jadi pedagang boleh menilai dan mengesahkan kefungsiannya. Terima kasih kepada penulis! Walaupuan anda boleh menggunakan secara percuma, ingat bahawa penerbitan semula kod ini tertakluk kepada Peraturan Dalaman.
Penafian
Maklumat dan penerbitan adalah tidak bertujuan, dan tidak membentuk, nasihat atau cadangan kewangan, pelaburan, dagangan atau jenis lain yang diberikan atau disahkan oleh TradingView. Baca lebih dalam Terma Penggunaan.
Skrip sumber terbuka
Dalam semangat TradingView sebenar, pencipta skrip ini telah menjadikannya sumber terbuka, jadi pedagang boleh menilai dan mengesahkan kefungsiannya. Terima kasih kepada penulis! Walaupuan anda boleh menggunakan secara percuma, ingat bahawa penerbitan semula kod ini tertakluk kepada Peraturan Dalaman.
Penafian
Maklumat dan penerbitan adalah tidak bertujuan, dan tidak membentuk, nasihat atau cadangan kewangan, pelaburan, dagangan atau jenis lain yang diberikan atau disahkan oleh TradingView. Baca lebih dalam Terma Penggunaan.