OPEN-SOURCE SCRIPT
Telah dikemas kini RSI Pie
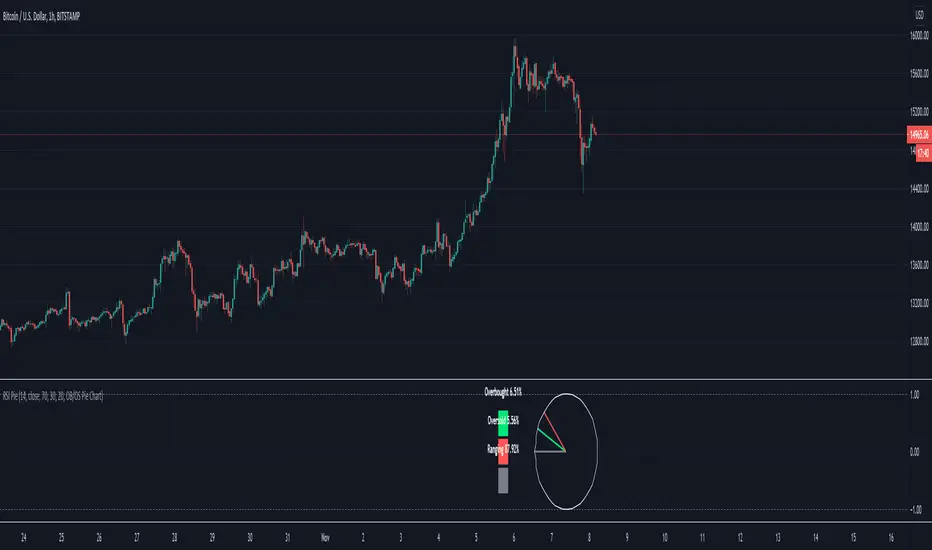
More a novelty than anything useful. Measures the % of overbought/sold RSI and renders as a pie chart. RSI % -> Radians -> (x,y) -> bar_time. 24hr market charts only.
Nota Keluaran
Defunct. See : [url=https://www.tradingview.com/script/pHlXdeXI-Pie-Chart-Toolbox/]Pie Chart ToolboxNota Keluaran
See script Pie Chart Toolbox 
Skrip sumber terbuka
Dalam semangat TradingView sebenar, pencipta skrip ini telah menjadikannya sumber terbuka, jadi pedagang boleh menilai dan mengesahkan kefungsiannya. Terima kasih kepada penulis! Walaupuan anda boleh menggunakan secara percuma, ingat bahawa penerbitan semula kod ini tertakluk kepada Peraturan Dalaman.
Penafian
Maklumat dan penerbitan adalah tidak bertujuan, dan tidak membentuk, nasihat atau cadangan kewangan, pelaburan, dagangan atau jenis lain yang diberikan atau disahkan oleh TradingView. Baca lebih dalam Terma Penggunaan.