OPEN-SOURCE SCRIPT
Telah dikemas kini MFI Divergence
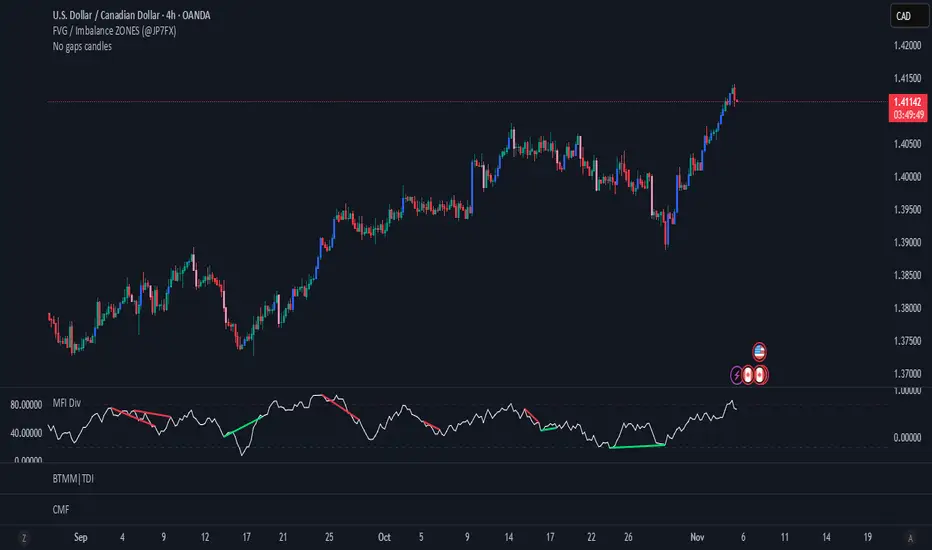
This indicator automatically detects bullish and bearish divergences between price and the Money Flow Index (MFI).
It’s designed for traders who use momentum divergence to anticipate potential trend reversals or continuation traps, and has been optimized to avoid false positives while still catching subtle setups on lower timeframes like 15m.
How It Works
Calculates the Money Flow Index (MFI) using price and volume.
Identifies swing highs and lows on the MFI using adaptive pivot logic.
Compares MFI pivots against corresponding price highs/lows:
Bullish Divergence: Price makes a lower low while MFI makes a higher low.
Bearish Divergence: Price makes a higher high while MFI makes a lower high.
Displays divergences as green (bullish) or red (bearish) lines on the MFI chart.
Nota Keluaran
add center lineSkrip sumber terbuka
Dalam semangat sebenar TradingView, pencipta skrip ini telah menjadikannya sumber terbuka supaya pedagang dapat menilai dan mengesahkan kefungsiannya. Terima kasih kepada penulis! Walaupun anda boleh menggunakannya secara percuma, ingat bahawa menerbitkan semula kod ini adalah tertakluk kepada Peraturan Dalaman kami.
Penafian
Maklumat dan penerbitan adalah tidak dimaksudkan untuk menjadi, dan tidak membentuk, nasihat untuk kewangan, pelaburan, perdagangan dan jenis-jenis lain atau cadangan yang dibekalkan atau disahkan oleh TradingView. Baca dengan lebih lanjut di Terma Penggunaan.
Skrip sumber terbuka
Dalam semangat sebenar TradingView, pencipta skrip ini telah menjadikannya sumber terbuka supaya pedagang dapat menilai dan mengesahkan kefungsiannya. Terima kasih kepada penulis! Walaupun anda boleh menggunakannya secara percuma, ingat bahawa menerbitkan semula kod ini adalah tertakluk kepada Peraturan Dalaman kami.
Penafian
Maklumat dan penerbitan adalah tidak dimaksudkan untuk menjadi, dan tidak membentuk, nasihat untuk kewangan, pelaburan, perdagangan dan jenis-jenis lain atau cadangan yang dibekalkan atau disahkan oleh TradingView. Baca dengan lebih lanjut di Terma Penggunaan.