PROTECTED SOURCE SCRIPT
Telah dikemas kini [Vold] MFV + EMA + STDEV

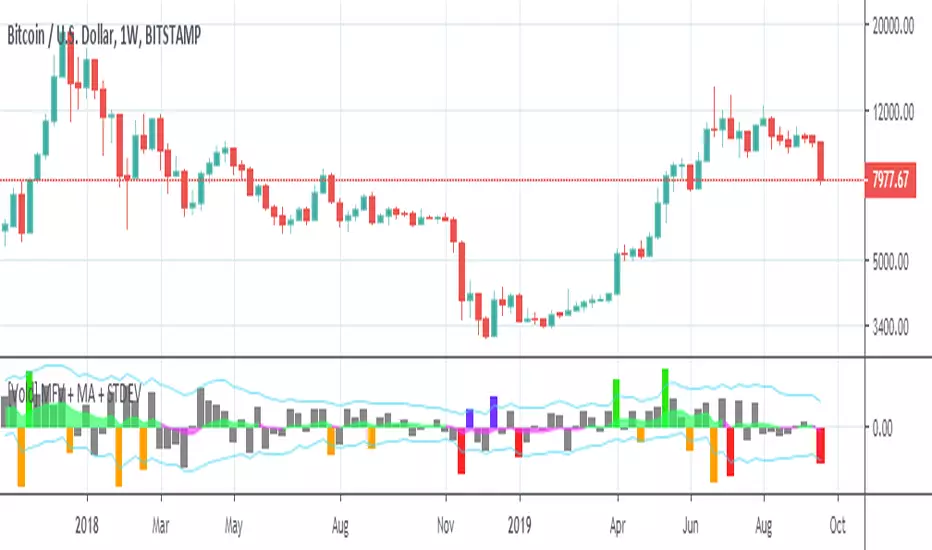
This indicator is a combination of Money Flow Volume with an Exponential Moving Average of the MFV and a Standard Deviation.
The default setup is better suited for the 1H timeframe.
The indicator shows Money Flow Volumes in bars positive and negative, an area which is the EMA of MFV of (20 default) periods, and the STDEV of that EMA (2 default multiplier/factor), when a MFV is greater than the upper limit or lower limit (given by the standard deviation of EMA of MFV), they show an extraordanary behaviour which can be attributed to FOMO (green), OPPORTUNITY (blue), FEAR (yellow), PANIC (RED).
Generally the indicator does not help to make a decision in real time, but it helps to determine what could come next after what is shows in the previous periods, for example:
In the chart there is a MFV bar that shows that a there's a candle that shows a reversal backed by a decent ammount of volume, if it's enough to turn the MFV EMA from fuchsia to green in the next 1-2 candles you can be pretty confident that it was an actual reversal.
Nota Keluaran
- Added "Color Themes": Used to change quickly the colors of all the elements to give contrast depending on the selected general color theme (Light or Dark).- Added an option to modify the type of moving average (Exponential, Simple or Weighted).
- Set 2 Standard Deviation Multiplier by default and added a step of 0.5 to increase or decrease it.
- Changed colors.
Nota Keluaran
- Chart UpdateNota Keluaran
Update to pinescript v4.By default this indicator is setup to be used in 4h time frame, but it can be used in any timeframe. You just need to adjust the moving average and the standard deviation. For example, Exponential 14, 1.2 dev works well for the Weekly.
I'd appreciate if you help out finding good setups for the different timeframes so that I can update the script to change the defaults either dinamically or with an option.
Skrip dilindungi
Skrip ini diterbitkan sebagai sumber tertutup. Akan tetapi, anda boleh menggunakannya secara bebas dan tanpa apa-apa had – ketahui lebih di sini.
Penafian
Maklumat dan penerbitan adalah tidak bertujuan, dan tidak membentuk, nasihat atau cadangan kewangan, pelaburan, dagangan atau jenis lain yang diberikan atau disahkan oleh TradingView. Baca lebih dalam Terma Penggunaan.