OPEN-SOURCE SCRIPT
Telah dikemas kini TFEX_INDICATOR_SET13
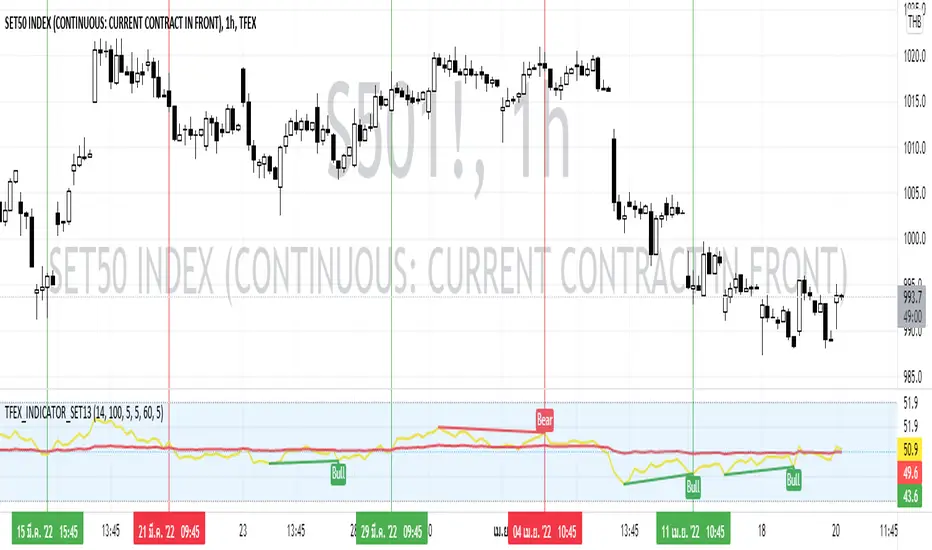
This Indicator use the calculated RSI of the top 13 stocks that have the highest market capitalization in  SET50 where suitable for TFEX trading(
 S501!).
Conducted with 2 RSI period as follow:
How to use:
1) Use this Indicator by Crossover
2) Use this Indicator by Divergence of RSI Main
3) The combination of Divergence and Crossover
Preferred Timeframe
Conducted with 2 RSI period as follow:
- RSI Main (14)
- RSI Average (100)
How to use:
1) Use this Indicator by Crossover
- If the RSI Main Cross UP the RSI Average can assume as BUY SIGNAL
- If the RSI Main Cross DOWN the RSI Average can assume as SELL SIGNAL
2) Use this Indicator by Divergence of RSI Main
- If the RSI Main got any Regular Bullish or Hidden Bullish can assume as BUY SIGNAL
- If the RSI Main got any Regular Bearish or Hidden Bearish can assume as SELL SIGNAL
3) The combination of Divergence and Crossover
- If the RSI Main got any Regular Bullish or Hidden Bullish then pending for the RSI Main Cross UP the RSI Average which can assume as BUY SIGNAL
- If the RSI Main got any Regular Bearish or Hidden Bearish then pending for the RSI Main Cross DOWN the RSI Average which can assume as SELL SIGNAL
Preferred Timeframe
- 4H
- 2H
- 1H
Nota Keluaran
Update name of the RSI appearance settingNota Keluaran
Add Alert ConditionsNota Keluaran
Change Calculation from SCB to EA as SCB delisted in SETNota Keluaran
Update Alert condition to have Overbought and OversoldEdit last description: Change Calculation from SCB to CPN as SCB delisted in SET
Nota Keluaran
Update ChartNota Keluaran
Update NEW SET13 List- AOT
- PTT
- DELTA
- PTTEP
- BCP
- CPALL
- KBANK
- DTAC
- BBL
- BDMS
- ESSO
- KTB
- GULF
Nota Keluaran
Update new stock listSkrip sumber terbuka
Dalam semangat TradingView sebenar, pencipta skrip ini telah menjadikannya sumber terbuka, jadi pedagang boleh menilai dan mengesahkan kefungsiannya. Terima kasih kepada penulis! Walaupuan anda boleh menggunakan secara percuma, ingat bahawa penerbitan semula kod ini tertakluk kepada Peraturan Dalaman.
Penafian
Maklumat dan penerbitan adalah tidak bertujuan, dan tidak membentuk, nasihat atau cadangan kewangan, pelaburan, dagangan atau jenis lain yang diberikan atau disahkan oleh TradingView. Baca lebih dalam Terma Penggunaan.
Skrip sumber terbuka
Dalam semangat TradingView sebenar, pencipta skrip ini telah menjadikannya sumber terbuka, jadi pedagang boleh menilai dan mengesahkan kefungsiannya. Terima kasih kepada penulis! Walaupuan anda boleh menggunakan secara percuma, ingat bahawa penerbitan semula kod ini tertakluk kepada Peraturan Dalaman.
Penafian
Maklumat dan penerbitan adalah tidak bertujuan, dan tidak membentuk, nasihat atau cadangan kewangan, pelaburan, dagangan atau jenis lain yang diberikan atau disahkan oleh TradingView. Baca lebih dalam Terma Penggunaan.