PROTECTED SOURCE SCRIPT
Long and Short Signal_1hours [zavaUnni]
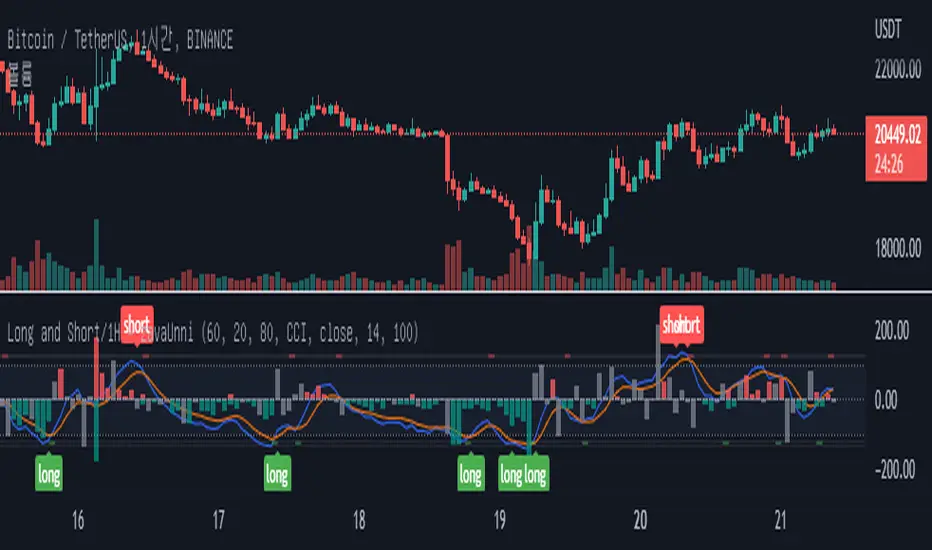
This indicator is available in the 1 hour chart.
The Stochastic value of 1 hour of 3 types of length was requested, summed, and then the value was derived.
The blue line is the K and the orange line is D of the Stochastic.
The default is Stochastic, but when RSI is selected in the settings, it can be viewed as the relative strength index of the Stochastic.


[Signal]
If the K value crosses down at 100, a short signal is generated
Cross up below -100 and you'll get a long signal.
You can receive a ready signal by checking Position Ready in Settings.
Short ready signal when the k line goes up to 100.
Long ready signal when the k line goes below -100.

[Histogram]
A small spread value of the candle relative to the volume is the principle that resistance has occurred.
Displayed the resistance value based on the average value of the last 100 candles.
The higher the value of the red Histogram, the stronger the selling.
The lower the value of the green Histogram value, the stronger the buying .
The gray histogram is when there's no buying or selling pressure.
The Stochastic value of 1 hour of 3 types of length was requested, summed, and then the value was derived.
The blue line is the K and the orange line is D of the Stochastic.
The default is Stochastic, but when RSI is selected in the settings, it can be viewed as the relative strength index of the Stochastic.
[Signal]
If the K value crosses down at 100, a short signal is generated
Cross up below -100 and you'll get a long signal.
You can receive a ready signal by checking Position Ready in Settings.
Short ready signal when the k line goes up to 100.
Long ready signal when the k line goes below -100.
[Histogram]
A small spread value of the candle relative to the volume is the principle that resistance has occurred.
Displayed the resistance value based on the average value of the last 100 candles.
The higher the value of the red Histogram, the stronger the selling.
The lower the value of the green Histogram value, the stronger the buying .
The gray histogram is when there's no buying or selling pressure.
Skrip dilindungi
Skrip ini diterbitkan sebagai sumber tertutup. Akan tetapi, anda boleh menggunakannya secara bebas dan tanpa apa-apa had – ketahui lebih di sini.
Penafian
Maklumat dan penerbitan adalah tidak bertujuan, dan tidak membentuk, nasihat atau cadangan kewangan, pelaburan, dagangan atau jenis lain yang diberikan atau disahkan oleh TradingView. Baca lebih dalam Terma Penggunaan.