PROTECTED SOURCE SCRIPT
Telah dikemas kini Today, Previous Day, and Two Days Ago Levels
Overview
This indicator plots key price levels from the current trading day, the previous day, and two days ago directly on your chart. Designed for traders who rely on daily price action, it displays the high, low, and close of the previous day, as well as the high and low of two days ago, alongside the developing high and low of the current day. Each level is drawn as a horizontal line with customizable visibility and distinct colors for easy identification.
Features
Today’s Levels: Shows the current day’s high (green) and low (red) as they develop during the regular trading session (9:30 AM–4:00 PM EDT).
Previous Day Levels: Plots the high (blue), low (light blue), and close (purple) of the most recent completed trading day, updating after 4:00 PM EDT.
Two Days Ago Levels: Displays the high (orange) and low (light orange) from two trading days prior.
Customizable Display: Toggle each level on or off via input settings to focus on the data that matters to you.
Session-Based Accuracy: Uses the regular U.S. equity session (9:30 AM–4:00 PM EDT) to ensure levels reflect standard trading hours.
How It Works
The indicator fetches daily price data based on the regular trading session (9:30 AM–4:00 PM EDT, Monday–Friday). After the session closes at 4:00 PM EDT, the "Previous Day" levels shift to reflect the just-completed day’s high, low, and close, while "Two Days Ago" levels update to the day before that. This makes it ideal for pre-market analysis the next morning, ensuring you’re always working with the latest completed session data.
Usage
Intraday Trading: Use on 1-minute, 5-minute, or 15-minute charts to monitor key levels during the day or in pre-market.
Daily Analysis: View on daily charts to assess historical levels, with updates reflecting the latest session after 4:00 PM EDT.
Support/Resistance: Leverage these levels as potential support and resistance zones for your trading strategy.
Limitations
Timeframe Consistency: Works best on intraday charts (e.g., 1-min, 5-min, 15-min, 30-min, 60-min). On higher timeframes (e.g. daily , weekly, monthly), the levels may not align as expected due to the daily session focus.
Securities Traded: Optimized for U.S. equities with a 9:30 AM–4:00 PM EDT session (e.g., stocks like SPY, AAPL). May not work correctly for:
Futures or Forex: These markets have different session hours (e.g., 5:00 PM EDT close for some futures), which could misalign the levels.
Non-U.S. Markets: Securities with different trading hours (e.g., European or Asian exchanges) won’t match the hardcoded EDT session.
Time Zone Dependency: Assumes a UTC-4 (EDT) timezone. If your chart or TradingView settings use a different timezone (e.g., EST, UTC), the session close detection (4:00 PM EDT) may be off.
Extended Hours: Excludes pre-market and after-hours data, focusing only on regular session prices. If you need extended hours, this indicator won’t reflect those levels.
Notes
Published under the Mozilla Public License 2.0.
Created on November 20, 2024, with updates for accuracy as of March 27, 2025.
If you encounter issues (e.g., levels not updating correctly), check your symbol’s session hours and chart timezone match the U.S. equity standard (9:30 AM–4:00 PM EDT).
Enjoy trading with clearer daily levels!
Nota Keluaran
OverviewThis indicator plots key price levels from the current trading day, the previous day, and two days ago directly on your chart. Designed for traders who rely on daily price action, it displays the high, low, and close of the previous day, as well as the high and low of two days ago, alongside the developing high and low of the current day. Each level is drawn as a horizontal line with customizable visibility and distinct colors for easy identification.
Features
Today’s Levels: Shows the current day’s high (green) and low (red) as they develop during the regular trading session (9:30 AM–4:00 PM EDT).
Previous Day Levels: Plots the high (blue), low (light blue), and close (purple) of the most recent completed trading day, updating after 4:00 PM EDT.
Two Days Ago Levels: Displays the high (orange) and low (light orange) from two trading days prior.
Customizable Display: Toggle each level on or off via input settings to focus on the data that matters to you.
Session-Based Accuracy: Uses the regular U.S. equity session (9:30 AM–4:00 PM EDT) to ensure levels reflect standard trading hours.
How It Works
The indicator fetches daily price data based on the regular trading session (9:30 AM–4:00 PM EDT, Monday–Friday). After the session closes at 4:00 PM EDT, the "Previous Day" levels shift to reflect the just-completed day’s high, low, and close, while "Two Days Ago" levels update to the day before that. This makes it ideal for pre-market analysis the next morning, ensuring you’re always working with the latest completed session data.
Usage
Intraday Trading: Use on 1-minute, 5-minute, or 15-minute charts to monitor key levels during the day or in pre-market.
Daily Analysis: View on daily charts to assess historical levels, with updates reflecting the latest session after 4:00 PM EDT.
Support/Resistance: Leverage these levels as potential support and resistance zones for your trading strategy.
Limitations
Timeframe Consistency: Works best on intraday charts (e.g., 1-min, 5-min, 15-min, 30-min, 60-min). On higher timeframes (e.g. daily , weekly, monthly), the levels may not align as expected due to the daily session focus.
Securities Traded: Optimized for U.S. equities with a 9:30 AM–4:00 PM EDT session (e.g., stocks like SPY, AAPL). May not work correctly for:
Futures or Forex: These markets have different session hours (e.g., 5:00 PM EDT close for some futures), which could misalign the levels.
Non-U.S. Markets: Securities with different trading hours (e.g., European or Asian exchanges) won’t match the hardcoded EDT session.
Time Zone Dependency: Assumes a UTC-4 (EDT) timezone. If your chart or TradingView settings use a different timezone (e.g., EST, UTC), the session close detection (4:00 PM EDT) may be off.
Extended Hours: Excludes pre-market and after-hours data, focusing only on regular session prices. If you need extended hours, this indicator won’t reflect those levels.
Notes
Published under the Mozilla Public License 2.0.
Created on November 20, 2024, with updates for accuracy as of March 27, 2025.
If you encounter issues (e.g., levels not updating correctly), check your symbol’s session hours and chart timezone match the U.S. equity standard (9:30 AM–4:00 PM EDT).
Enjoy trading with clearer daily levels!
Nota Keluaran
This is an updated script, and the key levels are updated once the session opens according to Trading view. Earlier version was supposed to fetch these levels right after close and plot them for the next day analysis, but the script failed to do that. This newer version works well, but the levels are only updated as soon as the session is opened, not before. This has something to do with how some functions are designed to fetch data through Pine Script and their limitations. Nota Keluaran
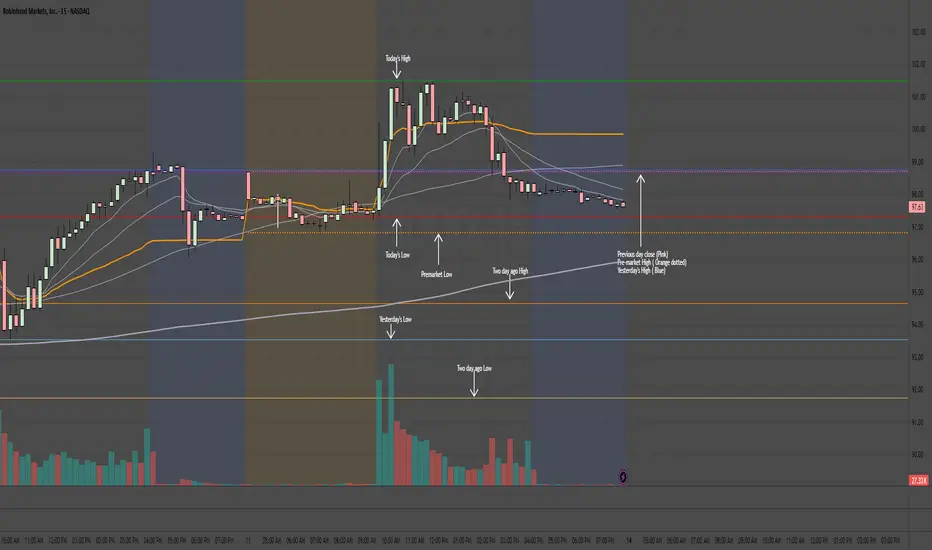
This script dynamically tracks key price levels across premarket, regular, and prior sessions, now all resetting at 4:00 AM ET, the start of premarket. This enhancement provides a stronger foundation for premarket analysis.Premarket High and Low:
Between 4:00 AM and 9:30 AM ET, two dotted orange lines represent the current session's premarket high and low. These levels remain fixed throughout the regular trading session and do not reset until the next day's premarket begins.
Today's High and Low (Regular Session):
From 9:30 AM to 4:00 PM ET, a green line (high) and a red line (low) track the regular session's high and low in real-time. These lines remain visible even after market close and post-market hours.
However, they will disappear when the next day's premarket starts, as the current day's levels then shift to represent yesterday's high and low (displayed in different colors as explained below).
Levels Updated at 4:00 AM Premarket Start:
Previous Day's Close: A pink solid line indicates the official close price of the previous trading day.
Yesterday's High and Low: A dark blue line (high) and a light blue line (low) reflect the previous day's high and low, replacing the green and red lines of the prior session.
Two Days Ago High and Low: A dark orange line (high) and a light orange line (low) mark the highs and lows from two trading days ago, replacing the dark and light blue lines.
https://www.tradingview.com/x/MsN1mBIE/
Nota Keluaran
//Chart UpdateNota Keluaran
Added full user customization for Previous Day Close and Session lines.– Toggle each line on/off
– Choose custom colors, widths, and styles
– All original drawing logic (4 AM reset, session handling) remains unchanged
– Inputs now streamlined for easier control
P.S. The script is designed specifically for equities and has not been tested for other asset classes. The code may break on timeframes higher than daily and may occasionally misbehave for tickers with little or no pre-market activity.
P.S. Turn off "Inputs in status line" to hide the long string that shows up in the indicators panel (top-left corner).
Skrip dilindungi
Skrip ini diterbitkan sebagai sumber tertutup. Akan tetapi, anda boleh menggunakannya secara bebas dan tanpa apa-apa had – ketahui lebih di sini.
Penafian
Maklumat dan penerbitan adalah tidak bertujuan, dan tidak membentuk, nasihat atau cadangan kewangan, pelaburan, dagangan atau jenis lain yang diberikan atau disahkan oleh TradingView. Baca lebih dalam Terma Penggunaan.