OPEN-SOURCE SCRIPT
DRIP Yearly Performance
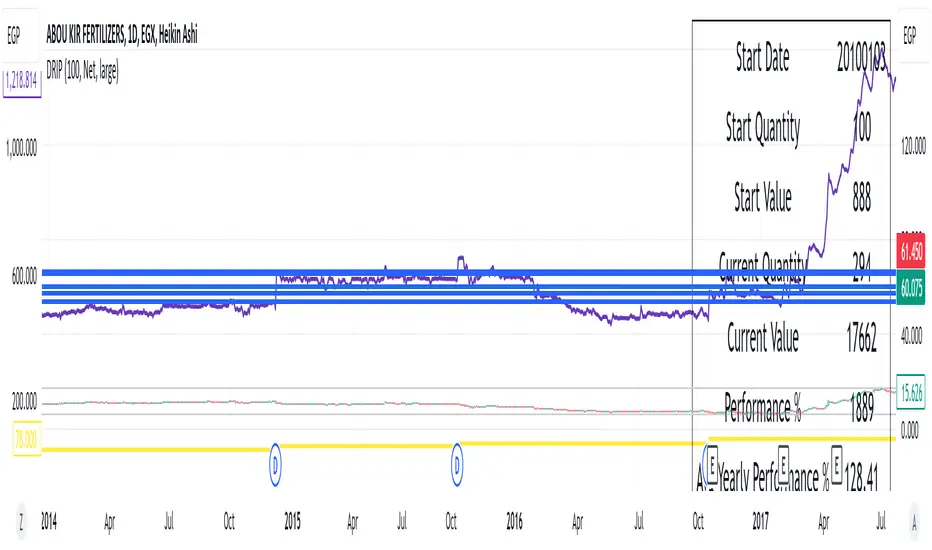
Overview: The DRIP Yearly Performance indicator is designed for long-term investors using Dividend Reinvestment Plans (DRIP). This script calculates both the total and average yearly performance of an asset, factoring in the reinvestment of dividends over time. It provides key insights into portfolio growth by tracking the number of accumulated units from dividend reinvestment and how this impacts overall performance.
Key Features:
Inputs Explained:
Who Can Benefit: This indicator is ideal for long-term investors and dividend growth investors who want to measure their investment returns over time while factoring in the effects of dividend reinvestment.
Use Cases:
Key Features:
- Dividend Reinvestment (DRIP) Calculation: Automatically adjusts the number of units held by reinvesting dividends, enhancing the calculation of total returns.
- Custom Start Date: Choose a custom start date to begin tracking performance from a specific time period, allowing for more tailored performance analysis.
- Performance Metrics: Displays key metrics such as the initial investment value, current value, total performance percentage, and the average yearly performance, all in an easy-to-read table format.
- Visual Representation: Plots accumulated units and overall performance on the chart, with customizable colors for clarity.
Inputs Explained:
- Start Quantity: Define the initial number of units (shares) held at the start of the investment.
- Dividend Type: Choose between tracking Net or Gross dividends for reinvestment purposes. Net is always better unless you have a special case and you need to base your calculations on gross.
- Start Date: Select a custom date to begin tracking performance. This allows users to focus on performance from any historical point.
- Table Size: Customize the size of the text in the performance table to suit your visual preferences.
- Performance Line Color: Choose the color of the performance plot line that tracks the value of your investment over time.
- Accumulator Line Color: Customize the color of the line that tracks the accumulated units (shares) due to reinvested dividends.
Who Can Benefit: This indicator is ideal for long-term investors and dividend growth investors who want to measure their investment returns over time while factoring in the effects of dividend reinvestment.
Use Cases:
- Tracking Dividend Impact: See how reinvesting dividends enhances your overall portfolio value.
- Custom Performance Analysis: Set a custom start date to analyze performance from a specific point in time.
- Visualizing Growth: Use the chart's plots to visually track your growing number of shares (units) and overall performance.
Skrip sumber terbuka
Dalam semangat TradingView sebenar, pencipta skrip ini telah menjadikannya sumber terbuka, jadi pedagang boleh menilai dan mengesahkan kefungsiannya. Terima kasih kepada penulis! Walaupuan anda boleh menggunakan secara percuma, ingat bahawa penerbitan semula kod ini tertakluk kepada Peraturan Dalaman.
Penafian
Maklumat dan penerbitan adalah tidak bertujuan, dan tidak membentuk, nasihat atau cadangan kewangan, pelaburan, dagangan atau jenis lain yang diberikan atau disahkan oleh TradingView. Baca lebih dalam Terma Penggunaan.