OPEN-SOURCE SCRIPT
DayHigh - Plot the Moving Average of the Daily High
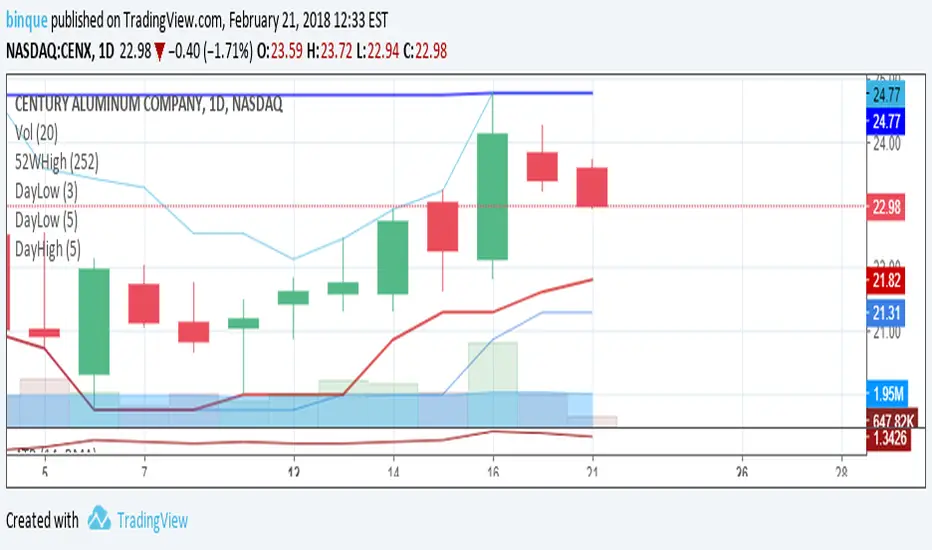
Plot the Moving Average of the Daily High for short periods of time (i.e 3 day or 5 day). Great for detecting when a stocks SELL pressure is running out and time to switch to a BUY strategy. Use in the DayHIGH indicator for nice price channels on a chart.
Skrip sumber terbuka
Dalam semangat TradingView sebenar, pencipta skrip ini telah menjadikannya sumber terbuka, jadi pedagang boleh menilai dan mengesahkan kefungsiannya. Terima kasih kepada penulis! Walaupuan anda boleh menggunakan secara percuma, ingat bahawa penerbitan semula kod ini tertakluk kepada Peraturan Dalaman.
Penafian
Maklumat dan penerbitan adalah tidak bertujuan, dan tidak membentuk, nasihat atau cadangan kewangan, pelaburan, dagangan atau jenis lain yang diberikan atau disahkan oleh TradingView. Baca lebih dalam Terma Penggunaan.