Linear Regression Trend Navigator [QuantAlgo]
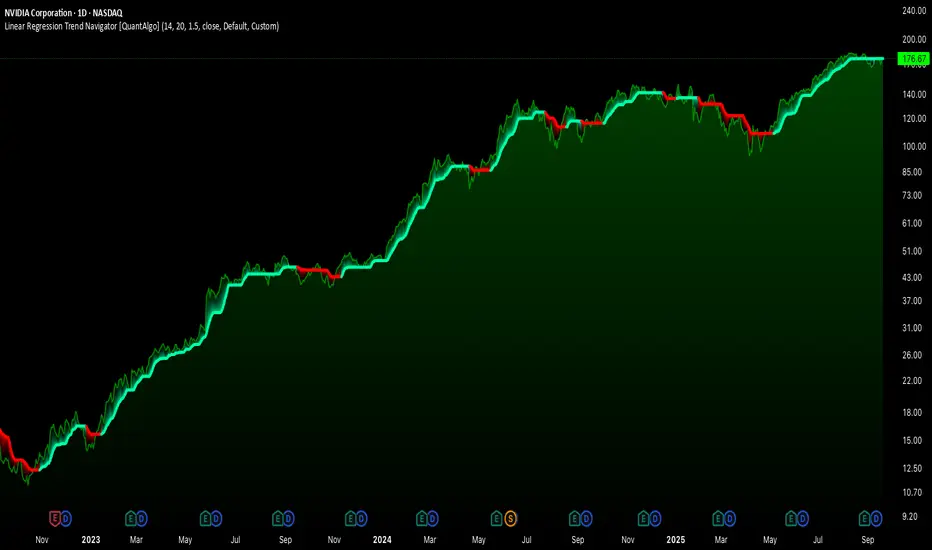
The Linear Regression Trend Navigator is a trend-following indicator that combines statistical regression analysis with adaptive volatility bands to identify and track dominant market trends. It employs linear regression mathematics to establish the underlying trend direction, while dynamically adjusting trend boundaries based on standard deviation calculations to filter market noise and maintain trend continuity. The result is a straightforward visual system where green indicates bullish conditions favoring buy/long positions, and red signals bearish conditions supporting sell/short trades.
🟢 How It Works
The indicator operates through a three-phase computational process that transforms raw price data into adaptive trend signals. In the first phase, it calculates a linear regression line over the specified period, establishing the mathematical best-fit line through recent price action to determine the underlying directional bias. This regression line serves as the foundation for trend analysis by smoothing out short-term price variations while preserving the essential directional characteristics.
The second phase constructs dynamic volatility boundaries by calculating the standard deviation of price movements over the defined period and applying a user-adjustable multiplier. These upper and lower bounds create a volatility-adjusted channel around the regression line, with wider bands during volatile periods and tighter bands during stable conditions. This adaptive boundary system operates entirely behind the scenes, ensuring the trend signal remains relevant across different market volatility regimes without cluttering the visual display.
In the final phase, the system generates a simple trend line that dynamically positions itself within the volatility boundaries. When price action pushes the regression line above the upper bound, the trend line adjusts to the upper boundary level. Conversely, when the regression line falls below the lower bound, the trend line moves to the lower boundary. The result is a single colored line that transitions between green (rising trend line = buy/long) and red (declining trend line = sell/short).
🟢 How to Use
- Green Trend Line: Upward momentum indicating favorable conditions for long positions, buy signals, and bullish strategies
- Red Trend Line: Downward momentum signaling optimal timing for short positions, sell signals, and bearish approaches
- Rising Green Line: Accelerating bullish momentum with steepening angles indicating strengthening upward pressure and potential for trend continuation
- Declining Red Line: Intensifying bearish momentum with increasing negative slopes suggesting persistent downward pressure and shorting opportunities
- Flattening Trend Lines: Gradual reduction in slope regardless of color may indicate approaching consolidation or momentum exhaustion requiring position review
🟢 Pro Tips for Trading and Investing
→ Entry/Exit Timing: Trade exclusively on band color transitions rather than price patterns, as each color change represents a statistically-confirmed shift that has passed through volatility filtering, providing higher probability setups than traditional technical analysis.
→ Parameter Optimization for Asset Classes: Customize the linear regression period based on your trading style. For example, use 5-10 bars for day trading to capture short-term statistical shifts, 14-20 for swing trading to balance responsiveness with stability, and 25-50 for position trading to filter out medium-term noise.
→ Volatility Calibration Strategy: Adjust the standard deviation multiplier according to market volatility. For instance, increase to 2.0+ during high-volatility periods like earnings or news events to reduce false signals, decrease to 1.0-1.5 during stable market conditions to maintain sensitivity to genuine trends.
→ Cross-Timeframe Statistical Validation: Apply the indicator across multiple timeframes simultaneously, using higher timeframes for directional bias and lower timeframes for entry timing.
→ Alert-Based Systematic Trading: Use built-in alerts to eliminate discretionary decision-making and ensure you capture every statistically-significant trend change, particularly effective for traders who cannot monitor charts continuously.
→ Risk Allocation Based on Signal Strength: Increase position sizes during periods of strong directional movement while reducing exposure during frequent band color changes that indicate statistical uncertainty or ranging conditions.
Skrip jemputan sahaja
Hanya pengguna disahkan oleh penulis boleh mengakses skrip ini. Anda perlu memohon dan mendapatkan kebenaran untuk menggunakannya. Keizinan selalunya diberikan selepas pembayaran. Untuk lebih butiran, ikuti arahan penulis di bawah atau hubungi QuantAlgo secara terus.
TradingView TIDAK menyarankan pembayaran atau penggunaan skrip kecuali anda mempercayai sepenuhnya penulis dan memahami bagaimana ia berfungsi. Anda juga boleh menjumpai alternatif sumber terbuka dan percuma yang lain di dalam skrip komuniti kami.
Arahan penulis
Penafian
Skrip jemputan sahaja
Hanya pengguna disahkan oleh penulis boleh mengakses skrip ini. Anda perlu memohon dan mendapatkan kebenaran untuk menggunakannya. Keizinan selalunya diberikan selepas pembayaran. Untuk lebih butiran, ikuti arahan penulis di bawah atau hubungi QuantAlgo secara terus.
TradingView TIDAK menyarankan pembayaran atau penggunaan skrip kecuali anda mempercayai sepenuhnya penulis dan memahami bagaimana ia berfungsi. Anda juga boleh menjumpai alternatif sumber terbuka dan percuma yang lain di dalam skrip komuniti kami.