Momentum Reversal Indicator (MRI)
The Momentum Reversal Indicator (MRI) is an advanced script for professional traders who have taken the time to learn all its functions. It is a time based indicator that anticipates the ending of trends based on the momentum in price movement. As an important secondary element, MRI also suggests when a trend might be starting or continuing, which a trader can certainly take advantage of. It is useful across all assets and all time frames but is ideal in more liquid assets on Daily & Weekly time frames.
Since this is an Invite Only Script, I will not be making the code public nor explain the math logic of the code here in TradingView. TradingView also limits any external links, but those interested in details or access should be resourceful enough to find all the information they need on my website. However, I will try and explain the usefulness of the MRI indicator with the following images.
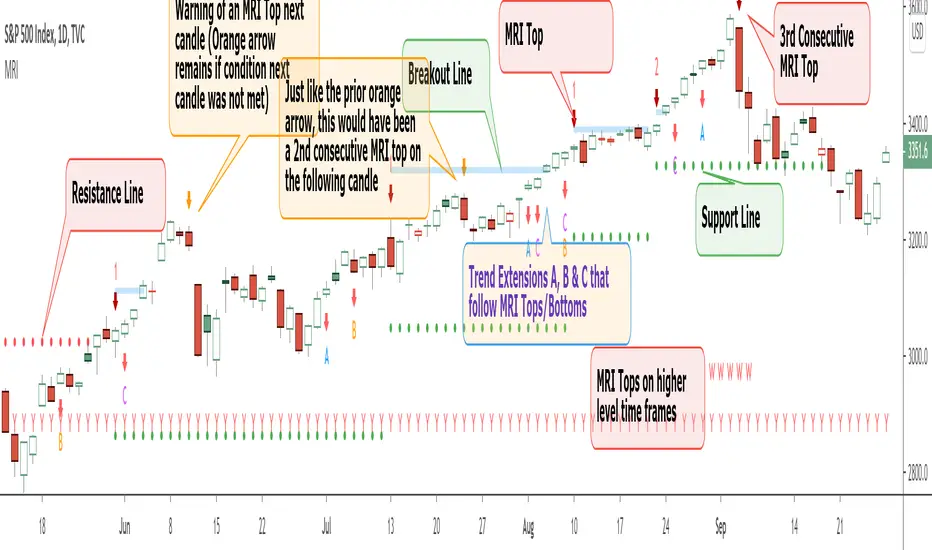
MRI will display a downwards red arrow above the candle when the bullish trend is ending and an upwards green arrow above the candle when the bearish trend is ending. The candle before the MRI top/bottom is marked by an orange arrow warning you that the trend might be ending on the next candle. (It's common that the trend ends on the candle before or after this MRI signal, I personally like to use single candlestick reversals for confirmation like Shooting Stars, Hammers and Doji). The orange arrow will disappear if a green or red arrow shows up, but will remain on the chart if on the following candle, the conditions needed to make the MRI signal are not met. See
When the number above the arrow is something other than a 1, it indicates a strong trend and the number represents consecutive instances of hitting that MRI extreme condition. These consecutive instances have been known to cause major changes in trend and the larger the number, the bigger the move might be. Here is a recent example of the
The biggest number I have seen is a 5, this occurred on the weekly chart of
Following an MRI Top/Bottom there are three different Extensions of trend if the price continues to move in the same direction and does not reverse with the MRI. It’s up to the trader to decide which of the three they find most relevant, for me it’s B & C, and there are settings you can use to remove what you don't care for from display. They have a different but similar rule set which is explained to those serious about the indicator and purchase access, which comes with full explanations in a video. Here is a recent chart of
And here is a weekly chart of
These Extensions are particularly useful when they occur on (or right around) an MRI Top/Bottom. Here is an example where it timed the 2018 stock market
In addition to Extensions, an MRI Top/Bottom generates a Resistance/Support line (dotted) and a Breakout Line (solid). The Support/Resistance not only has a tendency to reverse the price but also increases the probability of the MRI leading to a full reversal if the line is not broken. By breaking this dotted line, you increase the probability of entering the Extension of Trend. The Breakout line tends to notify the trader that the trend is very strong and continuing. As an example of Support line, here is a recent 1 hour
Here is
The indicator also shows you if the MRI is hitting critical levels on higher level time frames. We have set the defaults to Hourly (H), Daily (D), Weekly (W), Monthly (M) and Yearly (Y). You can turn these off in settings and you can also add up to 3 additional custom timeframes of your choice to the display list. When MRI lines up across several time frames it has a history of causing significant moves, here is an example of
The recent top in
One final note on the multi-timeframe is that if you have the Hourly (H) set to display on a chart that only has end of day data, the Indicator will not work so make sure to uncheck all timeframes that can't be identified in the settings.
Here are additional charts that show the power of MRI including cryptocurrencies:
Recent 25% crash in
Of course we have to mention
Volatility Index Weekly & Daily as of today
Here is the current look at the weekly USD chart
One more look at a stock chart, here we have the Weekly
Disclaimer: Trading is risky and using MRI (like any other indicator) does not guarantee positive returns. It does not blindly provide Buy/Sell/Short calls and the trader will need to evaluate every alert.
“The average man doesn’t wish to be told that it is a bull or a bear market. What he desires is to be told specifically which particular stock to buy or sell. He wants to get something for nothing. He does not wish to work. He doesn’t even wish to have to think.” - Jesse Livermore
Personal Note: I would like to credit the following people that all lead to the knowledge needed to build the MRI: Larry Williams, Tom DeMark, Tyler Jenks, Martin Armstrong & Kevin O’Dowd (most of whom I have met or interacted with)
Thank you everyone, if this indicator interests you, you know what to do...
Good Luck Trader,
Tone Vays
Skrip jemputan sahaja
Hanya pengguna disahkan oleh penulis boleh mengakses skrip ini. Anda perlu memohon dan mendapatkan kebenaran untuk menggunakannya. Keizinan selalunya diberikan selepas pembayaran. Untuk lebih butiran, ikuti arahan penulis di bawah atau hubungi ToneVays secara terus.
TradingView TIDAK menyarankan pembayaran atau penggunaan skrip kecuali anda mempercayai sepenuhnya penulis dan memahami bagaimana ia berfungsi. Anda juga boleh menjumpai alternatif sumber terbuka dan percuma yang lain di dalam skrip komuniti kami.
Arahan penulis
Web Site: ToneVays.com
Twitter & IG: @ToneVays
YouTube: YouTube.com/@TheFinancialSummit
Event: TheFinancialSummit.com
Conf: Unconfisctable.com
Penafian
Skrip jemputan sahaja
Hanya pengguna disahkan oleh penulis boleh mengakses skrip ini. Anda perlu memohon dan mendapatkan kebenaran untuk menggunakannya. Keizinan selalunya diberikan selepas pembayaran. Untuk lebih butiran, ikuti arahan penulis di bawah atau hubungi ToneVays secara terus.
TradingView TIDAK menyarankan pembayaran atau penggunaan skrip kecuali anda mempercayai sepenuhnya penulis dan memahami bagaimana ia berfungsi. Anda juga boleh menjumpai alternatif sumber terbuka dan percuma yang lain di dalam skrip komuniti kami.
Arahan penulis
Web Site: ToneVays.com
Twitter & IG: @ToneVays
YouTube: YouTube.com/@TheFinancialSummit
Event: TheFinancialSummit.com
Conf: Unconfisctable.com