OPEN-SOURCE SCRIPT
{MC} Rolling Ratio Table | {Dual Display} | V1
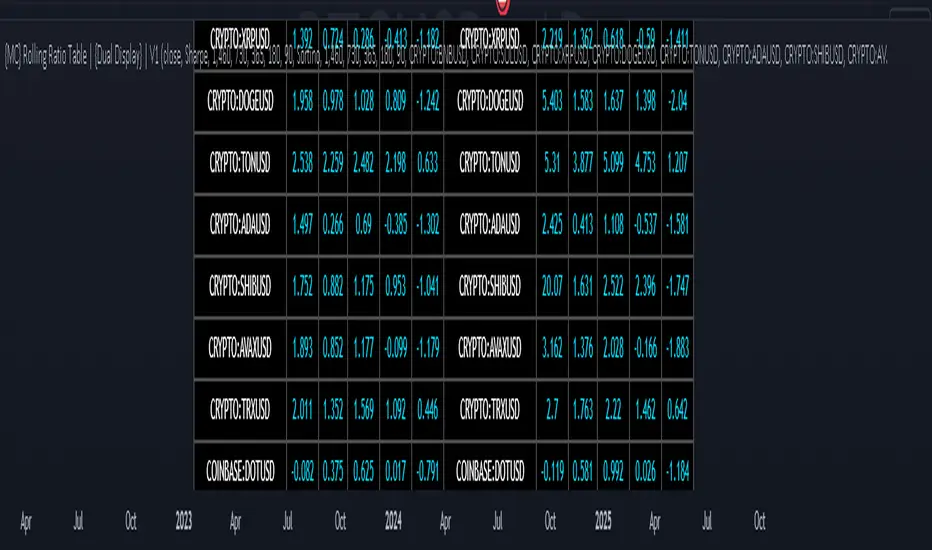
The {MC} Rolling Ratio Table | {Dual Display} | V1 incorporates the calculations from the indicator, “Rolling Risk-Adjusted Performance Ratios' ' which was originally designed by EliCobra. The {MC} Rolling Ratio Table | {Dual Display} | V1 indicator however displays the performance metrics for up to 30 assets across 5 adjustable lookback periods.
Overview
This indicator is designed for users to analyse the performance and risk-adjusted returns of various assets. It provides a comprehensive view by calculating and displaying key financial ratios Sharpe, Sortino, and Omega across multiple customizable lookback periods. The default lookback periods (days) are 1460, 730, 365, 180 & 90. This dual-display format allows users to compare these metrics side by side for up to 30 different assets.
Data Requests
The script uses the request.security function to fetch daily closing prices for each asset, ensuring that the data used in the calculations is current and accurate. This function retrieves the latest daily close prices for all 30 tickers, providing real-time performance metrics.
Sharpe Ratio
The Sharpe Ratio assesses an asset’s return relative to its risk by evaluating the average return and volatility of an asset. A higher Sharpe Ratio denotes better performance on a risk- adjusted basis. This ratio helps investors compare various assets or portfolios to evaluate if the returns are sufficient for the level of risk involved. In essence, a higher Sharpe Ratio means the asset yields more return for each unit of risk undertaken.
Sortino Ratio
The Sortino Ratio is a variation of the Sharpe Ratio that differentiates harmful volatility from overall volatility. It uses the standard deviation of negative returns (downside deviation) instead of the total standard deviation of returns. To calculate the Sortino Ratio, the return of an asset or portfolio is reduced by the risk-free rate, and the result is then divided by the downside deviation.
Omega Ratio
The Omega Ratio evaluates the probability-weighted ratio of gains to losses beyond a specified threshold or target return. It examines the skewness of an asset's returns by distinguishing between positive and negative returns and emphasising extreme outcomes. The Omega Ratio offers insights into the potential asymmetry of returns, revealing the likelihood of significant positive or negative outliers. A higher Omega Ratio signifies a greater probability of achieving substantial positive returns compared to substantial negative returns.
Addressing Lag
This indicator experiences slight lag compared to the simpler “Rolling Risk-Adjusted Performance Ratios” indicator due to the extensive computational requirements and data processing involved. The script fetches daily close prices for 30 different assets, making separate request.security calls for each asset, requiring the retrieval and processing of historical price data. For each asset, it calculates the data for each chosen ratio, involving multiple iterations over historical data points (1460, 730, 365, 180, 90 lengths by default).
Estimated Lag Duration
The exact duration of the lag can vary based on several factors, including the user's internet connection, the performance of the TradingView platform at the time, and the computational power of the user's device. However, it is generally expected to lag by approximately a few seconds to a minute. This minor delay is a trade-off for the convenience and comprehensive data presentation provided by the indicator.
Skrip sumber terbuka
Dalam semangat TradingView sebenar, pencipta skrip ini telah menjadikannya sumber terbuka, jadi pedagang boleh menilai dan mengesahkan kefungsiannya. Terima kasih kepada penulis! Walaupuan anda boleh menggunakan secara percuma, ingat bahawa penerbitan semula kod ini tertakluk kepada Peraturan Dalaman.
Penafian
Maklumat dan penerbitan adalah tidak bertujuan, dan tidak membentuk, nasihat atau cadangan kewangan, pelaburan, dagangan atau jenis lain yang diberikan atau disahkan oleh TradingView. Baca lebih dalam Terma Penggunaan.