PROTECTED SOURCE SCRIPT
SG Momentum
Hello All,
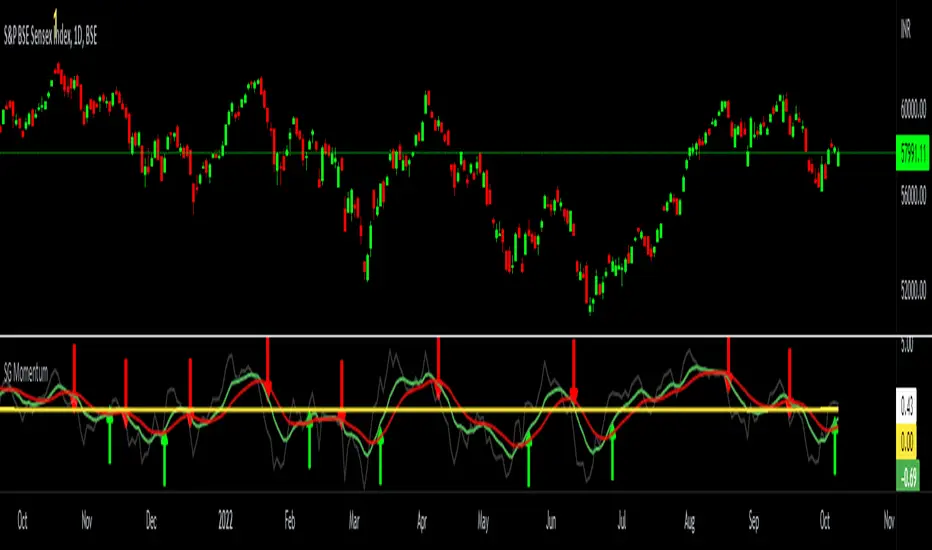
I have made a momentum indicator based on the distance from exponential moving average. This captures both buy and sell cycles effectively. The logic is to calculate the distance of closing price from an exponential moving average ( I use 13 period - You are free to choose any other period) - this is the dim grey line which you can toggle off too. Then I smoothen this by calculating a 9-period EMA of the same (the green line). I further slow it down by another 9-period EMA of the same ( the red line). Now when the green lines crosses the red line from below 0 it signifies a new bull cycle and vice versa for bear cycle. This works across all timeframes. I have marked few signals in the below chart for your reference.

I have made a momentum indicator based on the distance from exponential moving average. This captures both buy and sell cycles effectively. The logic is to calculate the distance of closing price from an exponential moving average ( I use 13 period - You are free to choose any other period) - this is the dim grey line which you can toggle off too. Then I smoothen this by calculating a 9-period EMA of the same (the green line). I further slow it down by another 9-period EMA of the same ( the red line). Now when the green lines crosses the red line from below 0 it signifies a new bull cycle and vice versa for bear cycle. This works across all timeframes. I have marked few signals in the below chart for your reference.
Skrip dilindungi
Skrip ini diterbitkan sebagai sumber tertutup. Akan tetapi, anda boleh menggunakannya secara bebas dan tanpa apa-apa had – ketahui lebih di sini.
Penafian
Maklumat dan penerbitan adalah tidak bertujuan, dan tidak membentuk, nasihat atau cadangan kewangan, pelaburan, dagangan atau jenis lain yang diberikan atau disahkan oleh TradingView. Baca lebih dalam Terma Penggunaan.