OPEN-SOURCE SCRIPT
RSI Call-outs Multi-resolution [BigBitsIO]
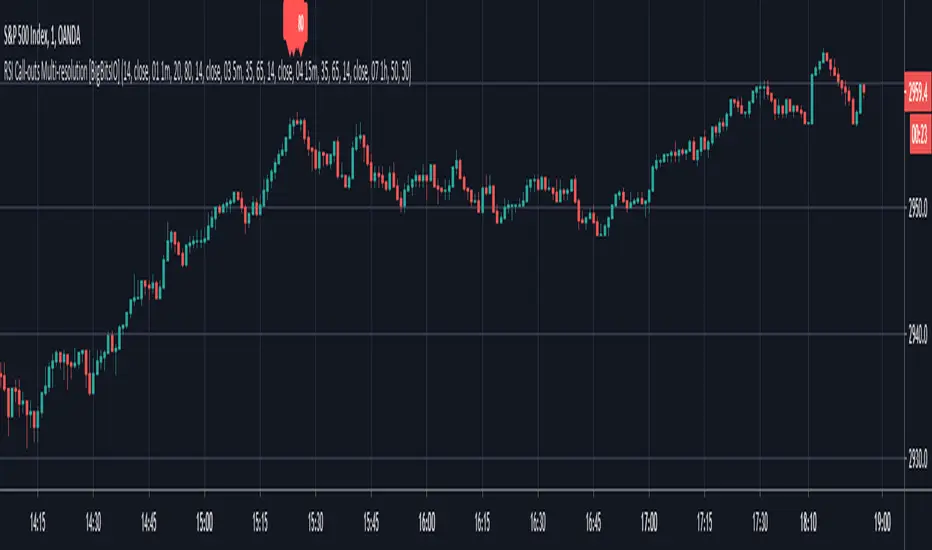
This is a simple multi-resolution (multi-timeframe) RSI indicator that overlays the current chart to show labels for specified oversold and overbought areas defined with inputs.
Up to 4 different resolutions/timeframes for their respective RSI (1,2,3, or 4). RSI1 is always enabled and can not be disabled.
Red labels with white text represent overbought RSI levels as defined by the user. All enabled RSI will have to qualify as overbought based on settings.
Green labels with black test represent oversold RSI levels as defined by the user. All enabled RSI will have to qualify as oversold based on settings.
This RSI overlay help easily call-out overbought and oversold candles on a chart where other RSI values on larger resolutions/timeframes are also oversold/overbought without sacrificing screen space for a traditional RSI indicator that is not overlayed on the chart.
This indicator has alert conditions that will trigger when all enabled RSI indicators are either oversold or overbought respective to your settings.
Note: The best results are to operate your chart as your smallest RSI resolution selected. Personally, I prefer to have my smallest (shortest timeframe) in RSI1, and go larger farther out to RSI4.
Skrip sumber terbuka
Dalam semangat TradingView sebenar, pencipta skrip ini telah menjadikannya sumber terbuka, jadi pedagang boleh menilai dan mengesahkan kefungsiannya. Terima kasih kepada penulis! Walaupuan anda boleh menggunakan secara percuma, ingat bahawa penerbitan semula kod ini tertakluk kepada Peraturan Dalaman.
Like and follow!
💻 Website: bigbits.io
📺 YouTube: youtube.com/bigbits
🎮 Discord: discord.gg/rapMn4z
🐦 Twitter: twitter.com/BigBitsIO
💸 Save $30 on TradingView Paid Plan: bit.ly/2CaRfjs
💻 Website: bigbits.io
📺 YouTube: youtube.com/bigbits
🎮 Discord: discord.gg/rapMn4z
🐦 Twitter: twitter.com/BigBitsIO
💸 Save $30 on TradingView Paid Plan: bit.ly/2CaRfjs
Penafian
Maklumat dan penerbitan adalah tidak bertujuan, dan tidak membentuk, nasihat atau cadangan kewangan, pelaburan, dagangan atau jenis lain yang diberikan atau disahkan oleh TradingView. Baca lebih dalam Terma Penggunaan.