PROTECTED SOURCE SCRIPT
Dynamic Pivot Point
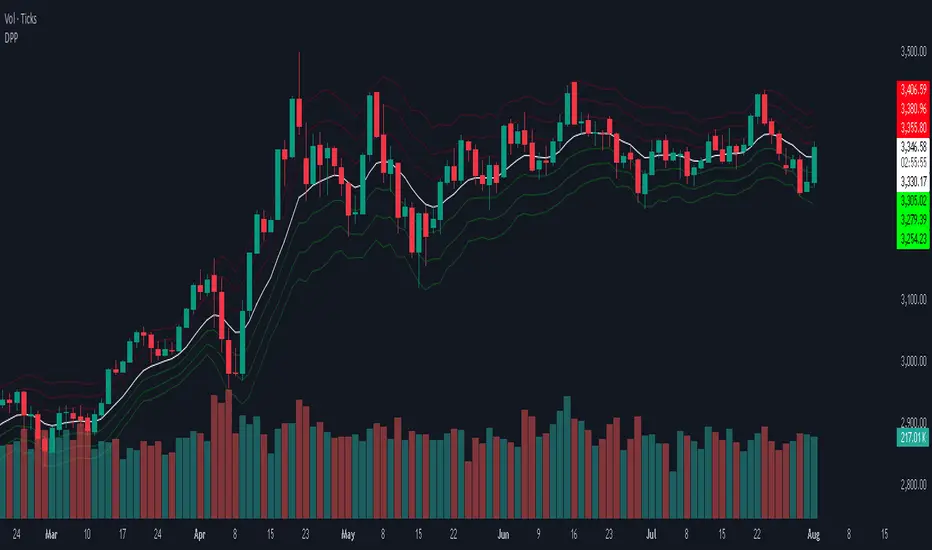
This indicator calculates and displays dynamic pivot points (Pivot, Support, and Resistance levels) based on a selected timeframe. These levels help traders identify potential price reversal zones, support/resistance, and trend direction.
it calculates:
Support Levels (S1, S2, S3)
Resistance Levels (R1, R2, R3)
Dynamic Feature:
a pivot defined period ( default = 5). you can change .
You can choose a specific timeframe (pivotTimeFrame) for calculating pivot levels (e.g., Daily, Weekly, etc.).
Visibility Toggle:
You can turn the pivot levels on or off using the input toggle.
Color Scheme:
Pivot Line: White
Support Levels: Green (S1, S2, S3)
Resistance Levels: Red (R1, R2, R3)
How to Trade With It:
1. Support and Resistance Reversals:
Buy near support levels (S1, S2, S3) if price shows bullish reversal signals.
Sell near resistance levels (R1, R2, R3) if price shows bearish reversal signals.
2. Breakout Trading:
Break above R1/R2/R3 with strong volume may indicate a bullish breakout — consider long positions.
Break below S1/S2/S3 may signal a bearish breakout — consider short positions.
3. Trend Confirmation:
If price stays above Pivot and supports hold — trend is likely bullish.
If price stays below Pivot and resistances hold — trend is likely bearish.
Skrip dilindungi
Skrip ini diterbitkan sebagai sumber tertutup. Akan tetapi, anda boleh menggunakannya dengan percuma dan tanpa had – ketahui lebih lanjut di sini.
Penafian
Maklumat dan penerbitan adalah tidak dimaksudkan untuk menjadi, dan tidak membentuk, nasihat untuk kewangan, pelaburan, perdagangan dan jenis-jenis lain atau cadangan yang dibekalkan atau disahkan oleh TradingView. Baca dengan lebih lanjut di Terma Penggunaan.