OPEN-SOURCE SCRIPT
Telah dikemas kini ADX and DI Trend meter and status table Indicator
This ADX (Average Directional Index) and DI (Directional Indicator) indicator helps identify:
Trend Direction & Strength:
LONG: +DI above -DI with ADX > 20
SHORT: -DI above +DI with ADX > 20
RANGE: ADX < 20 indicates choppy/sideways market
Trading Signals:
Bullish: +DI crosses above -DI (green triangle)
Bearish: -DI crosses below +DI (red triangle)
ADX Strength Levels:
Strong: ADX ≥ 50
Moderate: ADX 30-49
Weak: ADX 20-29
No Trend: ADX < 20
Best Uses:
Trend confirmation before entering trades
Identifying ranging vs trending markets
Exit signal when trend weakens
Works well on multiple timeframes
Most effective in combination with other indicators
The table displays current trend direction and ADX strength in real-time
Nota Keluaran
# Neutral ADX Trend StrengthA clean, modern implementation of the Average Directional Index (ADX) with trend detection and enhanced visual features. This indicator provides a neutral color palette and minimalist design while delivering powerful trend analysis.
---
## Features
- **Professional Appearance**: Neutral color palette with clean, modern styling
- **Enhanced ADX Visualization**: Clear representation of ADX, +DI, and -DI values
- **Smooth Area Fills**: Subtle area fills replace traditional columns for a cleaner look
- **Real-time Trend Signals**: Continuous position signals (0 to 1) for trend detection
- **Trend Strength Table**: Compact table showing current trend direction and strength
- **Customizable Settings**: Adjustable lengths, colors, and display options
---
## Indicator Components
### 1. ADX & Directional Indicators
- **ADX Line**: Measures overall trend strength regardless of direction
- **+DI Line**: Measures upward price movement strength (bullish)
- **-DI Line**: Measures downward price movement strength (bearish)
- **Threshold Line**: Customizable reference for minimum trend strength
### 2. Trend Signals
- **Long Signal**: Activates when +DI > -DI and ADX > Threshold
- **Short Signal**: Activates when -DI > +DI and ADX > Threshold
- **Toggle Option**: Ability to hide signals when needed
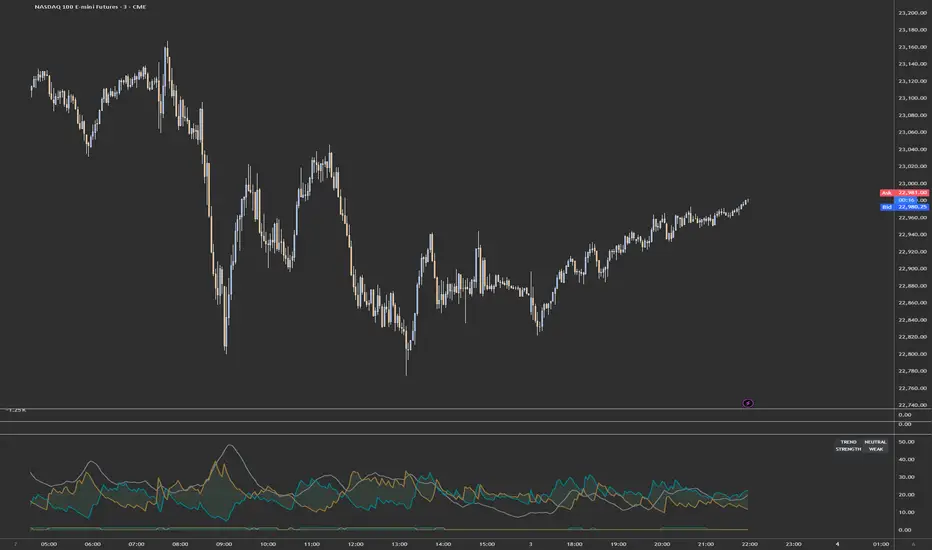
### 3. Trend Table
- **Direction**: Shows BULLISH, BEARISH, or NEUTRAL status
- **Strength**: Classifies trend as WEAK, MODERATE, STRONG, or VERY STRONG
- **Toggle Option**: Ability to hide the table when needed
---
## How to Use
### Trend Direction
- When the +DI line (teal) crosses above the -DI line (brown), look for bullish opportunities
- When the -DI line (brown) crosses above the +DI line (teal), look for bearish opportunities
### Trend Strength
- ADX below 20: No significant trend (range market)
- ADX 20-25: Early trend development
- ADX 25-35: Moderate trend strength
- ADX 35-50: Strong trend in progress
- ADX above 50: Very strong, potentially overextended trend
### Signal Interpretation
- When Long Signal = 1.0: Strong bullish trend conditions
- When Short Signal = 1.0: Strong bearish trend conditions
- When both signals = 0: Weak trend or ranging market
---
## Settings
### Main Parameters
- **ADX Length**: Calculation period for the ADX (default: 14)
- **DI Smoothing**: Smoothing period for directional indicators (default: 14)
- **ADX Threshold**: Minimum ADX value for trend signals (default: 20)
### Visual Options
- **Color Scheme**: Neutral teal (bullish), brown (bearish), and gray (ADX) palette
- **Area Transparency**: Adjust fill opacity to suit your chart style
- **Show/Hide Signals**: Toggle display of continuous trend signals
- **Show/Hide Table**: Toggle display of the trend direction/strength table
---
## Tips for Traders
- Combine with price action confirmation for best results
- Use higher timeframes for more reliable trend signals
- Consider ADX divergence from price for potential trend exhaustion
- Pay attention to how quickly ADX rises or falls when analyzing momentum
---
## About ADX
The Average Directional Index (ADX) was developed by J. Welles Wilder to quantify trend strength. Unlike other indicators that focus on direction, ADX specifically measures the strength of a trend regardless of whether it's up or down. The indicator includes the ADX line itself plus two directional components (+DI and -DI) that help determine trend direction.
---
## Compatibility
Designed for TradingView Pine Script v5. Compatible with all chart types and timeframes.
---
*This indicator is designed for educational and informational purposes only and should not be considered financial advice.*
Nota Keluaran
# ADX Trend StrengthA clean, modern implementation of the Average Directional Index (ADX) with trend detection and enhanced visual features. This indicator provides a neutral color palette and minimalist design while delivering powerful trend analysis.
---
## Features
- **Professional Appearance**: Neutral color palette with clean, modern styling
- **Enhanced ADX Visualization**: Clear representation of ADX, +DI, and -DI values
- **Smooth Area Fills**: Subtle area fills replace traditional columns for a cleaner look
- **Real-time Trend Signals**: Continuous position signals (0 to 1) for trend detection
- **Trend Strength Table**: Compact table showing current trend direction and strength
- **Customizable Settings**: Adjustable lengths, colors, and display options
---
## Indicator Components
### 1. ADX & Directional Indicators
- **ADX Line**: Measures overall trend strength regardless of direction
- **+DI Line**: Measures upward price movement strength (bullish)
- **-DI Line**: Measures downward price movement strength (bearish)
- **Threshold Line**: Customizable reference for minimum trend strength
### 2. Trend Signals
- **Long Signal**: Activates when +DI > -DI and ADX > Threshold
- **Short Signal**: Activates when -DI > +DI and ADX > Threshold
- **Toggle Option**: Ability to hide signals when needed
### 3. Trend Table
- **Direction**: Shows BULLISH, BEARISH, or NEUTRAL status
- **Strength**: Classifies trend as WEAK, MODERATE, STRONG, or VERY STRONG
- **Toggle Option**: Ability to hide the table when needed
---
## How to Use
### Trend Direction
- When the +DI line (teal) crosses above the -DI line (brown), look for bullish opportunities
- When the -DI line (brown) crosses above the +DI line (teal), look for bearish opportunities
### Trend Strength
- ADX below 20: No significant trend (range market)
- ADX 20-25: Early trend development
- ADX 25-35: Moderate trend strength
- ADX 35-50: Strong trend in progress
- ADX above 50: Very strong, potentially overextended trend
### Signal Interpretation
- When Long Signal = 1.0: Strong bullish trend conditions
- When Short Signal = 1.0: Strong bearish trend conditions
- When both signals = 0: Weak trend or ranging market
---
## Settings
### Main Parameters
- **ADX Length**: Calculation period for the ADX (default: 14)
- **DI Smoothing**: Smoothing period for directional indicators (default: 14)
- **ADX Threshold**: Minimum ADX value for trend signals (default: 20)
### Visual Options
- **Color Scheme**: Neutral teal (bullish), brown (bearish), and gray (ADX) palette
- **Area Transparency**: Adjust fill opacity to suit your chart style
- **Show/Hide Signals**: Toggle display of continuous trend signals
- **Show/Hide Table**: Toggle display of the trend direction/strength table
---
## Tips for Traders
- Combine with price action confirmation for best results
- Use higher timeframes for more reliable trend signals
- Consider ADX divergence from price for potential trend exhaustion
- Pay attention to how quickly ADX rises or falls when analyzing momentum
---
## About ADX
The Average Directional Index (ADX) was developed by J. Welles Wilder to quantify trend strength. Unlike other indicators that focus on direction, ADX specifically measures the strength of a trend regardless of whether it's up or down. The indicator includes the ADX line itself plus two directional components (+DI and -DI) that help determine trend direction.
---
## Compatibility
Designed for TradingView Pine Script v5. Compatible with all chart types and timeframes.
---
*This indicator is designed for educational and informational purposes only and should not be considered financial advice.*
Skrip sumber terbuka
Dalam semangat TradingView sebenar, pencipta skrip ini telah menjadikannya sumber terbuka, jadi pedagang boleh menilai dan mengesahkan kefungsiannya. Terima kasih kepada penulis! Walaupuan anda boleh menggunakan secara percuma, ingat bahawa penerbitan semula kod ini tertakluk kepada Peraturan Dalaman.
Penafian
Maklumat dan penerbitan adalah tidak bertujuan, dan tidak membentuk, nasihat atau cadangan kewangan, pelaburan, dagangan atau jenis lain yang diberikan atau disahkan oleh TradingView. Baca lebih dalam Terma Penggunaan.