Two Box Theory
Two Box Theory is a TradingView TM indicator that automatically locates and prints key support and resistance levels.
Its responsibility lies in its capacity to offer real-time visualisation to support your trade.
It is a flexible indicator that can be used for short or long time frames and has a precision of 8 decimal points, making it appropriate for all types of markets.
You can choose to get alerts immediately because each condition has its own set of alerts.
Two Box Theory has been tried, true, and tested for more than a year and has already earned the faith of those who have used it.
Two Box Theory has what it takes to take your trading to the next level, whether it's used as a stand-alone method or as an addition to your current approach.
Read the description to better understand the functions of this indicator.
1- It will automatically find Pivot Points to determine support and resistance by calculating extensive amount of data.
2- When it calculates new Pivot Points it will remove previous ones and the support/resistance channels will be updated.
3- For every upcoming Pivot Point it scans all previous Pivot Points in its channel horizontally.
4- It will show a different box (grey) when price action goes sideways. This is when the coin is in a no trade zone.
5- After breaking that level(grey box) upwards, it will change colour of its box to make support channel.
6- It will also alert you when the support or resistance breaks, you can set the alerts in the settings.
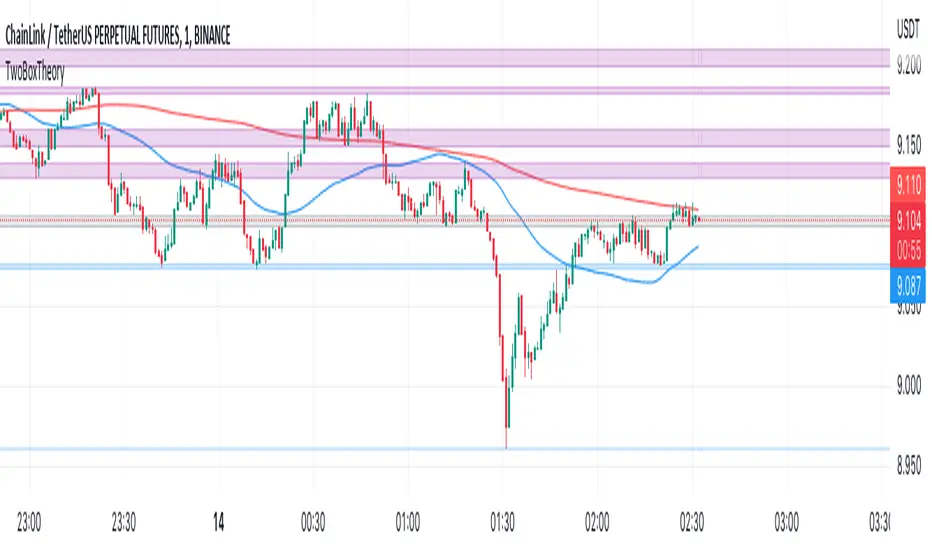
7- It also includes two Simple Moving Averages for further confirmations.
Here are some screenshots to understand how it functions:
The Auto-Support/Resistance feature in this indicator uses Artificial Intelligence (AI) to automatically plot the support/resistance levels and show them based on the strength of different levels to perform analysis.
AI is used to detect the support/resistance levels and rated based on the following factors:
i- Number of touches
ii- Length of the line
iii- Recency of the line
iv- Violations of the line
You can manage risk according to the support and resistance to set Stop-Loss and the potential take-profit based on the nearest support/resistance levels
Stop loss and take profit levels are made easy on this indicator and if you follow the instructions properly, your accuracy rate should lie between 85-95%
For example:
Support indications:
Resistance Indications and trading technique:
Resistance convert into support:
Skrip jemputan sahaja
Hanya pengguna disahkan oleh penulis boleh mengakses skrip ini. Anda perlu memohon dan mendapatkan kebenaran untuk menggunakannya. Keizinan selalunya diberikan selepas pembayaran. Untuk lebih butiran, ikuti arahan penulis di bawah atau hubungi MagnusPeterson secara terus.
TradingView TIDAK menyarankan pembayaran atau penggunaan skrip kecuali anda mempercayai sepenuhnya penulis dan memahami bagaimana ia berfungsi. Anda juga boleh menjumpai alternatif sumber terbuka dan percuma yang lain di dalam skrip komuniti kami.
Arahan penulis
Penafian
Skrip jemputan sahaja
Hanya pengguna disahkan oleh penulis boleh mengakses skrip ini. Anda perlu memohon dan mendapatkan kebenaran untuk menggunakannya. Keizinan selalunya diberikan selepas pembayaran. Untuk lebih butiran, ikuti arahan penulis di bawah atau hubungi MagnusPeterson secara terus.
TradingView TIDAK menyarankan pembayaran atau penggunaan skrip kecuali anda mempercayai sepenuhnya penulis dan memahami bagaimana ia berfungsi. Anda juga boleh menjumpai alternatif sumber terbuka dan percuma yang lain di dalam skrip komuniti kami.