OPEN-SOURCE SCRIPT
ALMA Trend Direction
Here is a very simple tool that uses the Arnaud Legoux Moving Average(ALMA). The ALMA is based on a normal distribution and is a reliable moving average due to its ability to reduce lag while still keeping a high degree of smoothness.
Input Options:
-Offset : Value in range {0,1} that adjusts the curve of the Gaussian Distribution. A higher value will result in higher responsiveness but lower smoothness. A lower value will mean higher smoothness but less responsiveness.
-Length : The lookback window for the ALMA calculation.
-Sigma : Defines the sharpe of the curve coefficients.
I find that this indicator is best used with a longer length and a 4 Hour timeframe. Overall, its purpose is to help identify the direction of a trend and determine whether a security is in an uptrend or a downtrend. For this purpose, it is best to use a lower offset value since we are looking to identify long-term, significant price movement rather than small fluctuations.
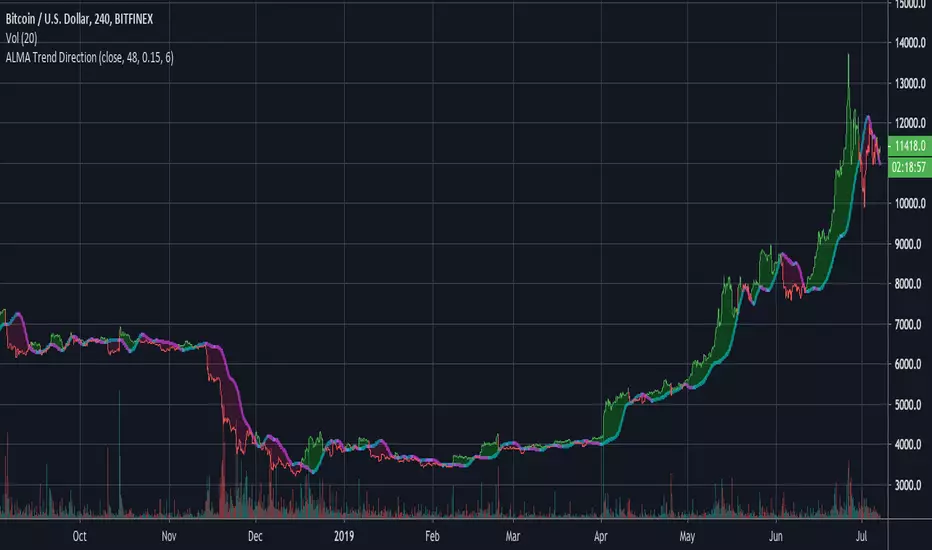
The Chart:
The ALMA is plotted as the aqua and pink alternating line. It is aqua when bullish and pink when bearish.
The low price for each candle is then compared to the ALMA. If the low is greater than the ALMA, then there is a bullish trend and the area between the candles and ALMA is filled green. The area between the ALMA and candles is filled red when the low price is less than the ALMA.
The difference between the slow ALMA and candles can reveal a lot about the current market state. If there is a significant green gap between the two, then we know that there is a significant uptrend taking place. On the other hand, a large red gap would indicate a significant downtrend. Similarly, if the gap between the two is narrowing and the ALMA line switches from aqua to pink, then we know that a reversal could be coming shortly.
~Happy Trading~
Input Options:
-Offset : Value in range {0,1} that adjusts the curve of the Gaussian Distribution. A higher value will result in higher responsiveness but lower smoothness. A lower value will mean higher smoothness but less responsiveness.
-Length : The lookback window for the ALMA calculation.
-Sigma : Defines the sharpe of the curve coefficients.
I find that this indicator is best used with a longer length and a 4 Hour timeframe. Overall, its purpose is to help identify the direction of a trend and determine whether a security is in an uptrend or a downtrend. For this purpose, it is best to use a lower offset value since we are looking to identify long-term, significant price movement rather than small fluctuations.
The Chart:
The ALMA is plotted as the aqua and pink alternating line. It is aqua when bullish and pink when bearish.
The low price for each candle is then compared to the ALMA. If the low is greater than the ALMA, then there is a bullish trend and the area between the candles and ALMA is filled green. The area between the ALMA and candles is filled red when the low price is less than the ALMA.
The difference between the slow ALMA and candles can reveal a lot about the current market state. If there is a significant green gap between the two, then we know that there is a significant uptrend taking place. On the other hand, a large red gap would indicate a significant downtrend. Similarly, if the gap between the two is narrowing and the ALMA line switches from aqua to pink, then we know that a reversal could be coming shortly.
~Happy Trading~
Skrip sumber terbuka
Dalam semangat TradingView sebenar, pencipta skrip ini telah menjadikannya sumber terbuka, jadi pedagang boleh menilai dan mengesahkan kefungsiannya. Terima kasih kepada penulis! Walaupuan anda boleh menggunakan secara percuma, ingat bahawa penerbitan semula kod ini tertakluk kepada Peraturan Dalaman.
-Profit Programmers
profitprogrammer.com
profitprogrammer.com
Penafian
Maklumat dan penerbitan adalah tidak bertujuan, dan tidak membentuk, nasihat atau cadangan kewangan, pelaburan, dagangan atau jenis lain yang diberikan atau disahkan oleh TradingView. Baca lebih dalam Terma Penggunaan.