OPEN-SOURCE SCRIPT
Telah dikemas kini Stock metrics and value

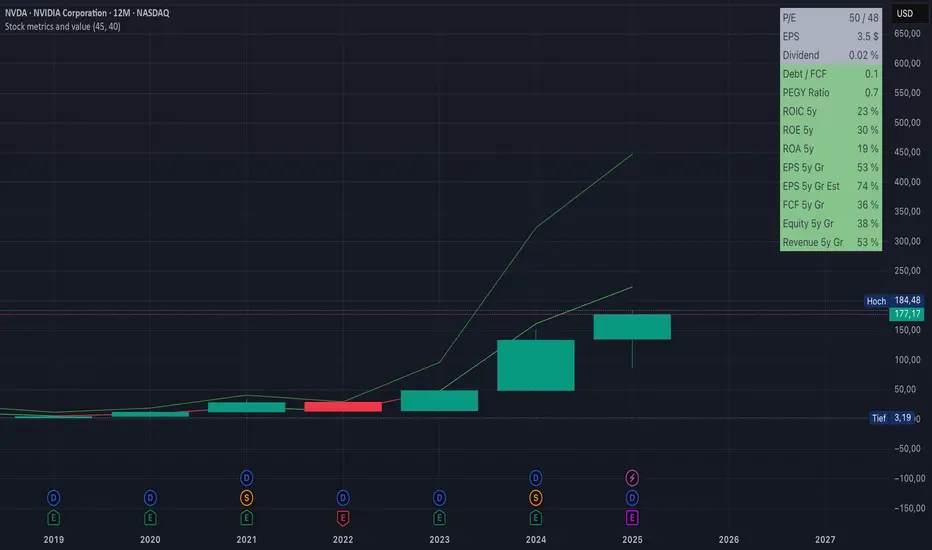
This indicator shows:
- the valuation metrics for a stock on a table on top right: PE, EPS, dividend, ROIC, ROE, ROA, EPS growth, FCF growth, Equity growth, revenue Growth
- the fair value and the value with 50% margin of safety as chart lines
The lines will be red when they are above the current price and red when they are below the current price.
The colors on the table will be red when the values are below 10% and green when they are above, that means when everything is green the metrics for the stock are good.
Nota Keluaran
Added the type "depository receipt" to be included for this indicatorNota Keluaran
- Changed the calculation of the value to estimate only 5 years ahead with 15% yield instead of 10 years- Changed the past growth calculations to 5 years instead of 10 years
Nota Keluaran
Added Peter Lynch's PEGY ratio, P/E devided by (growth rate + dividend yield)Skrip sumber terbuka
Dalam semangat TradingView sebenar, pencipta skrip ini telah menjadikannya sumber terbuka, jadi pedagang boleh menilai dan mengesahkan kefungsiannya. Terima kasih kepada penulis! Walaupuan anda boleh menggunakan secara percuma, ingat bahawa penerbitan semula kod ini tertakluk kepada Peraturan Dalaman.
Penafian
Maklumat dan penerbitan adalah tidak bertujuan, dan tidak membentuk, nasihat atau cadangan kewangan, pelaburan, dagangan atau jenis lain yang diberikan atau disahkan oleh TradingView. Baca lebih dalam Terma Penggunaan.
Skrip sumber terbuka
Dalam semangat TradingView sebenar, pencipta skrip ini telah menjadikannya sumber terbuka, jadi pedagang boleh menilai dan mengesahkan kefungsiannya. Terima kasih kepada penulis! Walaupuan anda boleh menggunakan secara percuma, ingat bahawa penerbitan semula kod ini tertakluk kepada Peraturan Dalaman.
Penafian
Maklumat dan penerbitan adalah tidak bertujuan, dan tidak membentuk, nasihat atau cadangan kewangan, pelaburan, dagangan atau jenis lain yang diberikan atau disahkan oleh TradingView. Baca lebih dalam Terma Penggunaan.