OPEN-SOURCE SCRIPT
Telah dikemas kini Gann Fan Analysis v 3.0
The openness of this community is amazing and I have gained a lot from being a member. Hopefully you think this is useful so I can give something back.
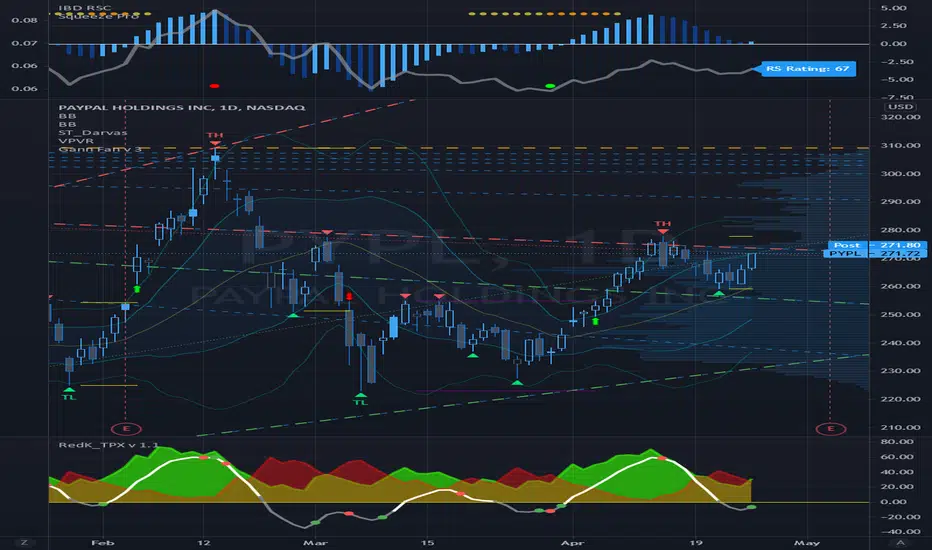
This indicator constructs a reference framework of Support and Resistance levels based on Gann Fan ratios. Two fans are created: Support or Bullish fan, and a Resistance or Bearish fan. The origin of the analysis is the lowest pivot in the analysis window set by the length input. The upper bound of the analysis is the highest pivot in the analysis window. This is the only user input that affects the fan calculation. The remaining user input controls the visualization of the fans. The fan calculations are updated as the high and low within the analysis window change. The resistance fan range is based on an assumed 70% retracement.
Indicator also highlights the active Support and Resistance lines of each fan. An alert is also included, based on the price crossing one of these active levels.
Currently I can't figure out how to get the analysis to extend beyond 278 or so bars (not sure what the limitation is) so it isn't really useful for intraday timeframes, but it is reliable on daily and above. I use it on a Weekly view with the analysis length set to 52, and on a daily timeframe with the length set to 260.
I included fractal visualization using Ricardo Santos' Fractals v9 script as a means of confirming the Gann Fan pivots. The two methods seems to correlate well, in my opinion.
The coding is terrible, I'm sure, so please overlook that as this my first complex effort. I'm a total amateur!
Nota Keluaran
Update to the original Alert to split it into 2 directionally specific AlertsNota Keluaran
A minor update that I've had a few requests for.Resistance and Support Fans are now defined symmetrically.
Skrip sumber terbuka
Dalam semangat TradingView sebenar, pencipta skrip ini telah menjadikannya sumber terbuka, jadi pedagang boleh menilai dan mengesahkan kefungsiannya. Terima kasih kepada penulis! Walaupuan anda boleh menggunakan secara percuma, ingat bahawa penerbitan semula kod ini tertakluk kepada Peraturan Dalaman.
Penafian
Maklumat dan penerbitan adalah tidak bertujuan, dan tidak membentuk, nasihat atau cadangan kewangan, pelaburan, dagangan atau jenis lain yang diberikan atau disahkan oleh TradingView. Baca lebih dalam Terma Penggunaan.