OPEN-SOURCE SCRIPT
RedK_Fibonacci on Doncian (RedK_FibDC_v1)
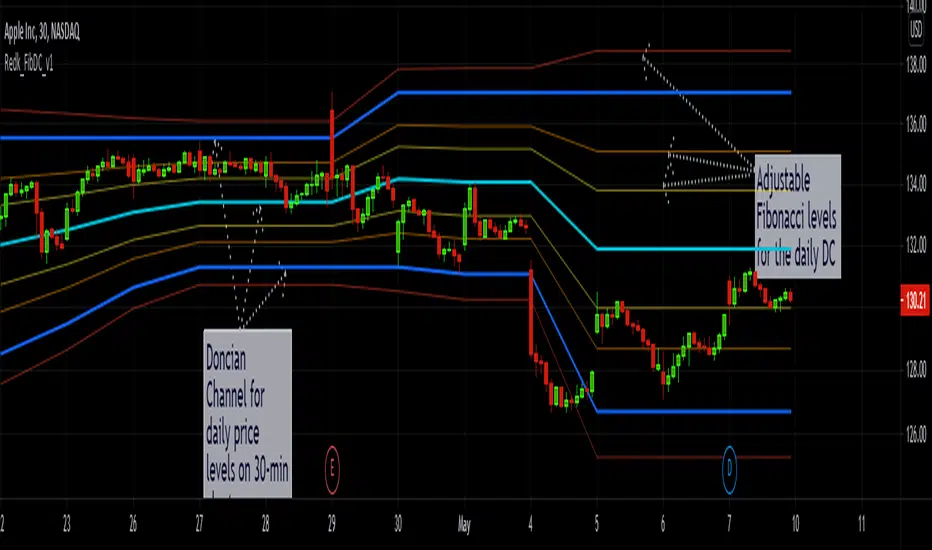
this is a quick script that gives the ability to plot a simple Doncian Channel with optional Fibonacci levels calculated against the DC channel breadth.
a Doncian channel is simply a channel that represents the highest high and lowest low of the price for a certain period (number of bars) -- the concept of watching these extreme values is the basis of many other technical indicators in chart analysis.
A script like this may come useful for setting entry and exit levels and can be used to plot the DC & Fib levels for a higher resolution than the chart - in the example, we're looking at the DC & its Fib levels for the daily resolution on a 30-min chart.
there are 3 adjustable levels that are set by default to 0.368, 0.618, and 1.272 -- and they can be set to any other levels we need to monitor - not necessarily Fib-based at all - say to determine a possible breakout or breakdown... etc
this script makes use of the "resolution" and "inline / group" features (powers) of Pine :)
Skrip sumber terbuka
Dalam semangat TradingView sebenar, pencipta skrip ini telah menjadikannya sumber terbuka, jadi pedagang boleh menilai dan mengesahkan kefungsiannya. Terima kasih kepada penulis! Walaupuan anda boleh menggunakan secara percuma, ingat bahawa penerbitan semula kod ini tertakluk kepada Peraturan Dalaman.
Penafian
Maklumat dan penerbitan adalah tidak bertujuan, dan tidak membentuk, nasihat atau cadangan kewangan, pelaburan, dagangan atau jenis lain yang diberikan atau disahkan oleh TradingView. Baca lebih dalam Terma Penggunaan.