OPEN-SOURCE SCRIPT
INTELLECT_city - abcd Pattern
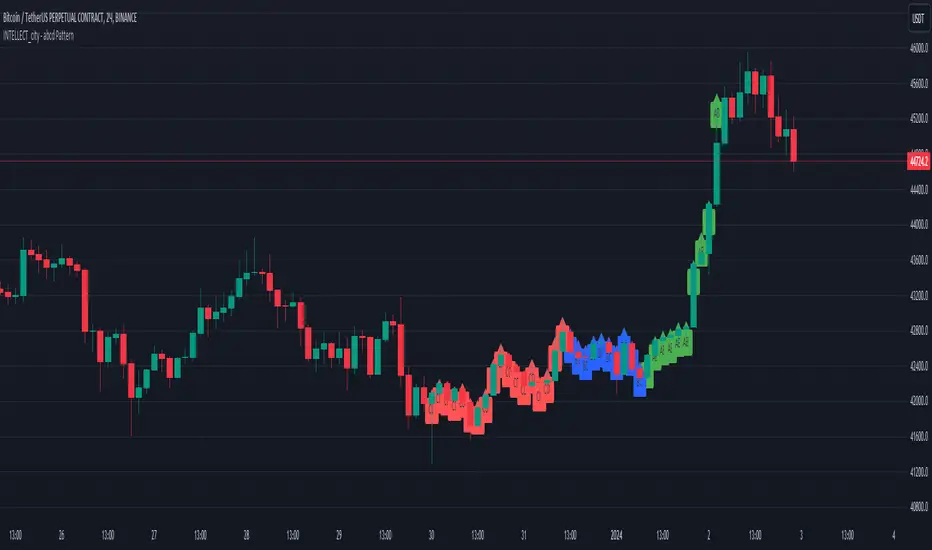
The ABCD Pattern indicator is a tool that helps identify potential geometric patterns of price movement on the chart of a financial instrument. This indicator is based on trading strategies that use the formation of four separate points, designated A, B, C and D.
Point A: The starting point of the pattern, which usually represents the end of the previous price trend.
Point B: The top of the first price wave directed against the current trend.
Point C: Completion of the second price wave started from point B. Often point C is formed at a level close to the completion of the correction.
Point D: The end point of the pattern where price forms a third wave directed towards the original trend.
The indicator displays the AB, BC and CD lines on the chart and also provides labels for these levels. This can help traders and analysts identify and analyze potential ABCD patterns on a price action chart.
It is important to remember that the ABCD Pattern does not guarantee successful trading and traders should combine it with other analysis methods and strategies to make informed decisions. Testing and adaptation to specific market conditions are also key steps when using this indicator.
Skrip sumber terbuka
Dalam semangat TradingView sebenar, pencipta skrip ini telah menjadikannya sumber terbuka, jadi pedagang boleh menilai dan mengesahkan kefungsiannya. Terima kasih kepada penulis! Walaupuan anda boleh menggunakan secara percuma, ingat bahawa penerbitan semula kod ini tertakluk kepada Peraturan Dalaman.
Penafian
Maklumat dan penerbitan adalah tidak bertujuan, dan tidak membentuk, nasihat atau cadangan kewangan, pelaburan, dagangan atau jenis lain yang diberikan atau disahkan oleh TradingView. Baca lebih dalam Terma Penggunaan.