OPEN-SOURCE SCRIPT
ROC Tide
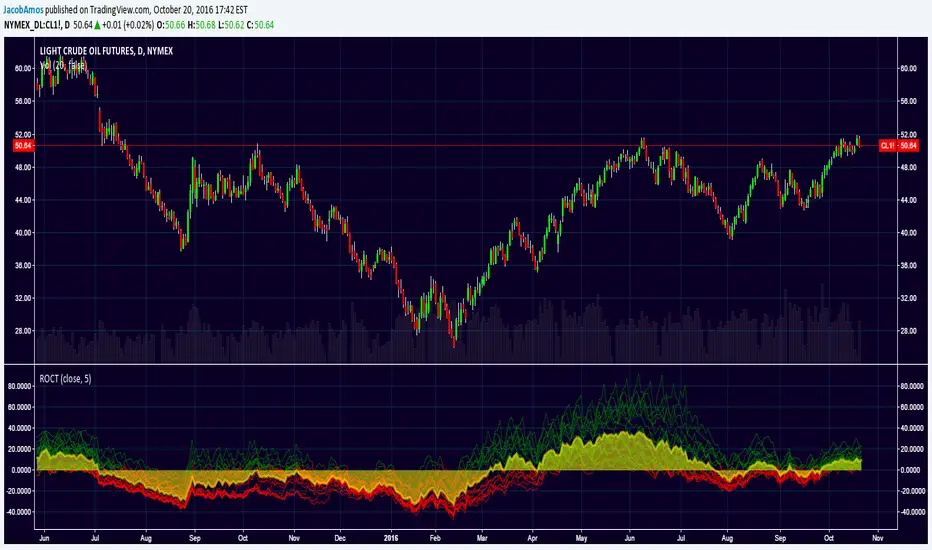
Adds some depth to the traditional rate of change (ROC) indicator. Instead of just having one ROC line with a single lookback period, this takes a minimum lookback period, n, and plots 20 ROC lines with lookback periods of n, 2n, 3n, ..., 20n. These lines will appear green when greater than zero, red when less than zero, and yellow when equal to zero by default.
Then it plots the average of those 20 ROC's as a yellow filled area so as to make it easier to see where the balance (or "tide") of the ROC waves are located.
Then it plots the average of those 20 ROC's as a yellow filled area so as to make it easier to see where the balance (or "tide") of the ROC waves are located.
Skrip sumber terbuka
Dalam semangat TradingView sebenar, pencipta skrip ini telah menjadikannya sumber terbuka, jadi pedagang boleh menilai dan mengesahkan kefungsiannya. Terima kasih kepada penulis! Walaupuan anda boleh menggunakan secara percuma, ingat bahawa penerbitan semula kod ini tertakluk kepada Peraturan Dalaman.
Penafian
Maklumat dan penerbitan adalah tidak bertujuan, dan tidak membentuk, nasihat atau cadangan kewangan, pelaburan, dagangan atau jenis lain yang diberikan atau disahkan oleh TradingView. Baca lebih dalam Terma Penggunaan.