PROTECTED SOURCE SCRIPT
FIB W-VWAP [A0A_Indicator]
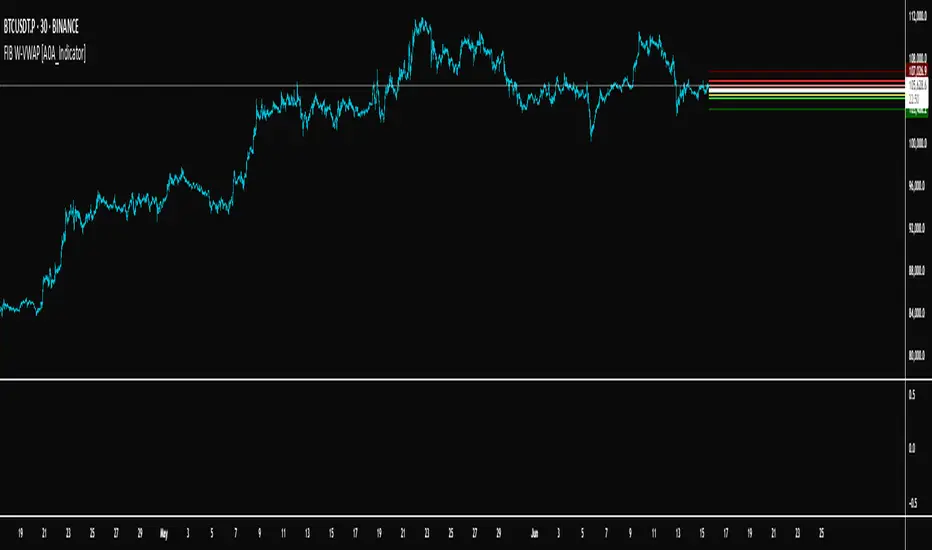
FIB W-VWAP [A0A_Indicator] is an advanced weekly anchored VWAP indicator that leverages Fibonacci-based deviation bands and a custom price source for improved market relevance.
Key Features:
Weekly Anchored VWAP: Resets automatically at the Friday NYSE close, providing a rolling weekly anchor that aligns with professional trading practice.
Fibonacci Deviation Levels: Plots multiple deviation bands around the VWAP, calculated using fixed Fibonacci-inspired multipliers for both positive and negative directions. These serve as key support and resistance zones for mean reversion or trend continuation strategies.
Dynamic Standard Deviation: Each band is based on the live, rolling standard deviation of price within the current weekly session, adapting in real time to changing volatility.
Unique Hybrid Price Source:
VWAP and deviation bands are calculated using a custom price formula:
hidden
This approach gives extra weight to the closing price while still considering intrabar extremes, resulting in a smoother and more robust anchor compared to classic VWAP formulas (such as typical price or close-only).
Visual Enhancements:
Distinct color fills and lines for each band
Configurable transparency and labels
Clearly marked VWAP and all deviation levels, labeled with their corresponding Fibonacci levels
Adaptable for Discretionary and Systematic Trading:
Useful for identifying mean reversion trades, breakouts, and overextended moves during the trading week.
How it works:
At each new weekly session (NY close on Friday), the VWAP and its standard deviation reset.
The script continuously updates cumulative price × volume, cumulative volume, and cumulative price² × volume to maintain accurate VWAP and standard deviation calculations.
Each deviation band is plotted as a multiple of the weekly standard deviation above and below the VWAP, using fixed Fibonacci coefficients.
Labels and horizontal lines extend into the future for clear, actionable visual reference.
Why use this version?
This indicator offers greater precision in turbulent markets, robust support/resistance mapping, and is especially effective for traders seeking a more nuanced, statistically informed view of weekly price structure. The hybrid source makes it more reliable during volatility spikes than classic VWAP methods.
Ready for all timeframes and asset classes—especially powerful for intraday and swing traders working with weekly cycles.
Skrip dilindungi
Skrip ini diterbitkan sebagai sumber tertutup. Akan tetapi, anda boleh menggunakannya secara bebas dan tanpa apa-apa had – ketahui lebih di sini.
Penafian
Maklumat dan penerbitan adalah tidak bertujuan, dan tidak membentuk, nasihat atau cadangan kewangan, pelaburan, dagangan atau jenis lain yang diberikan atau disahkan oleh TradingView. Baca lebih dalam Terma Penggunaan.