OPEN-SOURCE SCRIPT
Volume Weighted Average Price Z-Score [tordne]
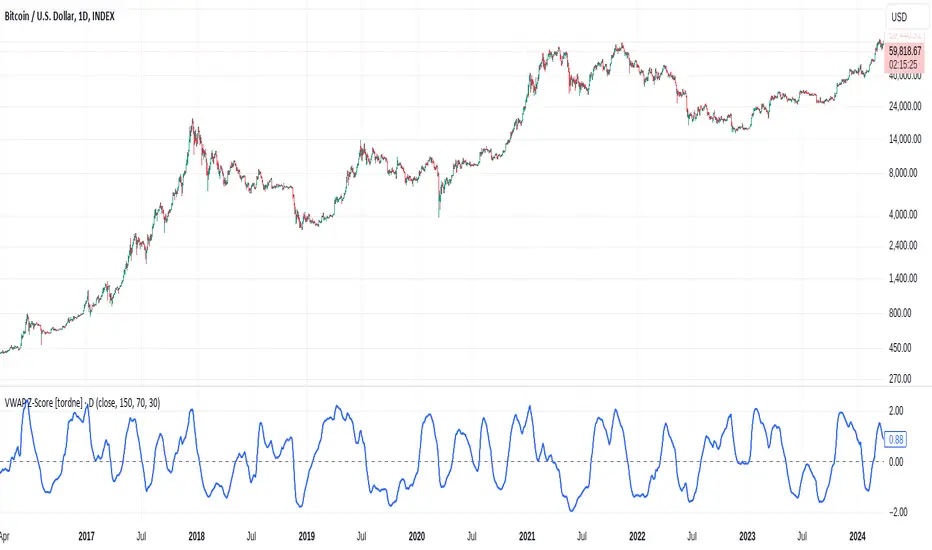
The VWAP Z-Score indicator calculates the Z-score of the Volume Weighted Average Price (VWAP) Ratio, allowing traders to analyze how the current price compares to the VWAP over a specified period. This can provide insights into the relative price strength, overbought/oversold conditions, and price deviations from its average.
Key Components:
VWAP Calculation:
VWAP (Volume Weighted Average Price) is the ratio of the cumulative traded value (price multiplied by volume) to the cumulative volume over a specified period (VWAP Calculation Length).
The VWAP Ratio is then computed by dividing the current price (or selected source) by the calculated VWAP.
Z-Score Calculation:
The Z-score is a statistical measure that shows how far the current VWAP Ratio deviates from its mean, in terms of standard deviations.
The Z-score is calculated by comparing the VWAP Ratio to its moving average (Z-Score Length) and dividing the difference by the standard deviation of the VWAP Ratio over the same period.
This helps in identifying whether the current price is unusually high or low relative to its VWAP.
Smoothing:
The Z-score is further smoothed using an Exponential Moving Average (EMA) to reduce noise and enhance readability. The smoothing length is adjustable via the input settings (Smoothing Length), with a default value of 14 periods.
Input Parameters:
Source: The price source used for calculation (default is the closing price).
VWAP Calculation Length: Defines the period over which the VWAP is calculated (default is 150).
Z-Score Length: The lookback period for calculating the Z-score (default is 70).
Smoothing Length (EMA): The number of periods over which to smooth the Z-score using an EMA (default is 30).
Interpretation:
Z-Score:
A Z-score close to 0 indicates that the price is close to its VWAP.
A positive Z-score suggests that the price is higher than its VWAP, potentially indicating overbought conditions.
A negative Z-score suggests that the price is lower than its VWAP, potentially indicating oversold conditions.
This indicator provides a dynamic and statistical way of assessing price movements relative to VWAP, aiding in mean reversion strategies, trend following, or momentum analysis.
Skrip sumber terbuka
Dalam semangat TradingView sebenar, pencipta skrip ini telah menjadikannya sumber terbuka, jadi pedagang boleh menilai dan mengesahkan kefungsiannya. Terima kasih kepada penulis! Walaupuan anda boleh menggunakan secara percuma, ingat bahawa penerbitan semula kod ini tertakluk kepada Peraturan Dalaman.
Penafian
Maklumat dan penerbitan adalah tidak bertujuan, dan tidak membentuk, nasihat atau cadangan kewangan, pelaburan, dagangan atau jenis lain yang diberikan atau disahkan oleh TradingView. Baca lebih dalam Terma Penggunaan.