PROTECTED SOURCE SCRIPT
Telah dikemas kini MeanReversion by Volatility
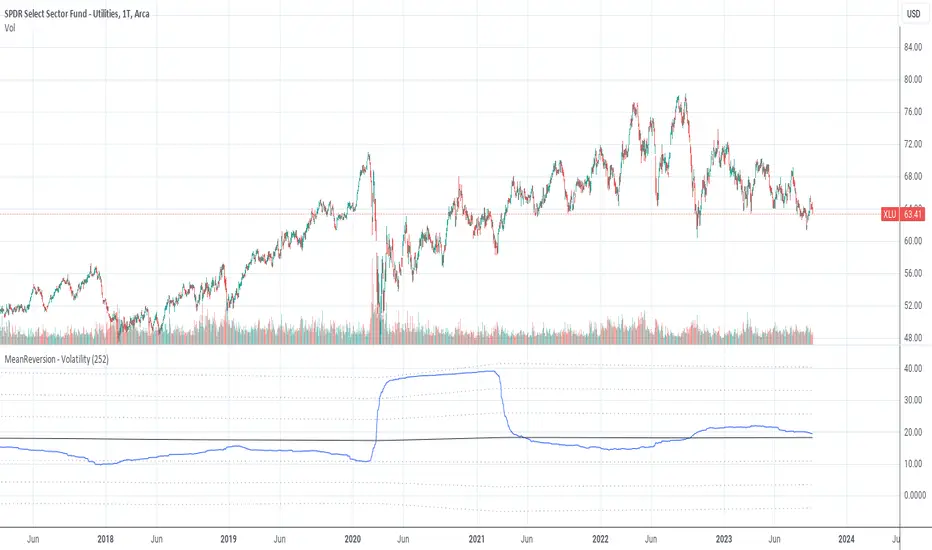
Mean reversion is a financial term for the assumption that an asset will return to its mean value.
This indicator calculate the volatility of an asset over a period of time and show the values of logRerturn, mean and standart deviations.
The default time period for volatility calculation is 252 bars at a "Daily" chart. At a "Daily" chart 252 bar means one trading-year.
See also:
MeanReversion by Logarithmic Returns
Nota Keluaran
Fixed wrong textNota Keluaran
Fixed wrong textNota Keluaran
fixed color Nota Keluaran
refactoringNota Keluaran
- removed plot offset for better visualizationSkrip dilindungi
Skrip ini diterbitkan sebagai sumber tertutup. Akan tetapi, anda boleh menggunakannya secara bebas dan tanpa apa-apa had – ketahui lebih di sini.
Penafian
Maklumat dan penerbitan adalah tidak bertujuan, dan tidak membentuk, nasihat atau cadangan kewangan, pelaburan, dagangan atau jenis lain yang diberikan atau disahkan oleh TradingView. Baca lebih dalam Terma Penggunaan.
Skrip dilindungi
Skrip ini diterbitkan sebagai sumber tertutup. Akan tetapi, anda boleh menggunakannya secara bebas dan tanpa apa-apa had – ketahui lebih di sini.
Penafian
Maklumat dan penerbitan adalah tidak bertujuan, dan tidak membentuk, nasihat atau cadangan kewangan, pelaburan, dagangan atau jenis lain yang diberikan atau disahkan oleh TradingView. Baca lebih dalam Terma Penggunaan.