OPEN-SOURCE SCRIPT
Telah dikemas kini [blackcat] L2 Trend Mirror Navigator TypeI
In this unpredictable world of trading, the L2 Trend Mirror Navigator TypeI is like a magical mirror, reflecting the market's pulse and potential turning points. This indicator is not just a game of numbers; it's a visual feast that reveals the market's deep secrets through five colorful lines (mb1, mb2, mb3, mb4, mb5). Imagine these lines as five lively little snakes, dancing on the chart, intertwining and separating at times, with each crossing potentially signaling a shift in market sentiment.
The calculation process of this indicator is like cooking a complex dish, requiring precise ingredients and火候 (heat control). First, we take the average of the high, low, and close prices, which serves as our "basic soup base." Then, we add the secret ingredient of Exponential Moving Average (EMA) to smooth out the price data, like adding a layer of delicate cream to the soup base. Next, through a series of complex calculations, we obtain five lines, each like a different dish with its own flavor, but together they form a bountiful trading feast.
In practical application, this indicator acts as your trading assistant, telling you the market's dynamics through lines of different colors. When the red line (mb2) is above the green line (mb3), it's like saying, "Hey, the market is rising!" Conversely, it warns you, "Be careful, the market might be falling." You can adjust the sensitivity of this indicator based on the length of the EMA period, just like adjusting the spiciness of a dish to suit your taste.
Now, let's explore how to combine this indicator with others to enhance the reliability of trading signals. Imagine you're observing a stock or currency pair, looking for the best time to buy or sell. You can combine the L2 Trend Mirror Navigator TypeI with Moving Averages (MA) or Average Directional Index (ADX), just like adding some herbs and spices to a dish to enrich the flavor. When the RSI indicator shows the market may be oversold, it's like telling you, "Now might be a good time to buy." And price behavior analysis serves as a reminder, "Watch out, the market might be forming a certain chart pattern."
Finally, don't forget the key factor of volume. It's like the salt in a dish; without it, everything becomes bland. Analyzing the signals of the L2 Trend Mirror Navigator across different time frames is like admiring a painting under different lights, each angle revealing a different beauty.
Nota Keluaran
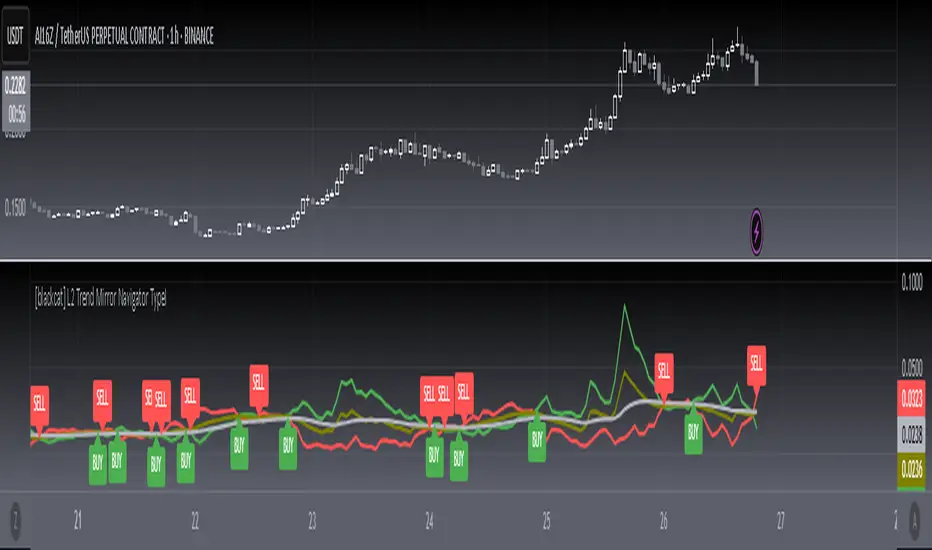
OVERVIEWThe [blackcat] L2 Trend Mirror Navigator TypeI is an advanced technical indicator designed to help traders identify potential buy and sell opportunities based on dynamic boundary prices. By calculating key levels such as upper, lower, and average boundary prices, along with their exponential moving averages (EMAs), this indicator provides valuable insights into market trends and momentum. It plots these boundaries on the chart and generates alerts when crossover events occur, signaling potential trade entries 📈💹.
FEATURES
Calculates multiple boundary prices:
Upper Boundary Price: Red line indicating resistance level.
Lower Boundary Price: Green line indicating support level.
Average Boundary Price: Olive line representing the midpoint between upper and lower boundaries.
EMA of Average Boundary Price: Silver line smoothing out the average boundary price.
Generates buy ('BUY') and sell ('SELL') labels on the chart for quick identification 🏷️
Produces alerts based on crossover events between boundary prices 🔔
Uses customizable periods for calculation flexibility ⚙️
HOW TO USE
Add the indicator to your TradingView chart by selecting it from the indicators list.
Monitor the chart for buy and sell labels indicating potential trade opportunities.
Set up alerts based on the generated signals to receive notifications when conditions are met 📲.
Use the plotted lines as reference points for identifying support and resistance levels.
LIMITATIONS
The indicator relies heavily on boundary price crossovers, which might not capture all market nuances.
False signals can occur in highly volatile or ranging markets 🌪️.
Users should always confirm signals with other forms of analysis before making trading decisions.
NOTES
Ensure that you have sufficient historical data available for accurate calculations.
Test the indicator thoroughly on demo accounts before applying it to live trading 🔍.
Customize the period lengths and appearance as needed to fit your trading strategy.
Skrip sumber terbuka
Dalam semangat TradingView sebenar, pencipta skrip ini telah menjadikannya sumber terbuka, jadi pedagang boleh menilai dan mengesahkan kefungsiannya. Terima kasih kepada penulis! Walaupuan anda boleh menggunakan secara percuma, ingat bahawa penerbitan semula kod ini tertakluk kepada Peraturan Dalaman.
Avoid losing contact!Don't miss out! The first and most important thing to do is to join my Discord chat now! Click here to start your adventure: discord.com/invite/ZTGpQJq 防止失联,请立即行动,加入本猫聊天群: discord.com/invite/ZTGpQJq
Penafian
Maklumat dan penerbitan adalah tidak bertujuan, dan tidak membentuk, nasihat atau cadangan kewangan, pelaburan, dagangan atau jenis lain yang diberikan atau disahkan oleh TradingView. Baca lebih dalam Terma Penggunaan.