OPEN-SOURCE SCRIPT
Telah dikemas kini [blackcat] L2 James Garofallou RSI In 4 Dim
Level 2
Background
Traders’ Tips of September 2020, the focus is James Garofallou’s article in the September issue, “Tracking Relative Strength In Four Dimensions”.
Function
In “Tracking Relative Strength In Four Dimensions” in this issue, author James Garofallou introduces us to a new method of measuring the relative strength of a security. This new technique creates a much broader reference than would be obtained by using a single security or index and combines several dimensions, as the author calls them, into a single rank value. This study compares a security to another in four dimensions, as explained in the article. James Garofallou presents a metric for a security’s strength relative to 11 major market sectors and over several time periods. All this is squeezed into a single value. The first step is the RS2. It normalizes the security to a market index, then calculates four moving averages and encodes their relations in a returned number. I just modified it by using most BTC-correlated instruments to reflect how BTC response to their performance.
Remarks
This is a Level 2 free and open source indicator.
Feedbacks are appreciated.
Nota Keluaran
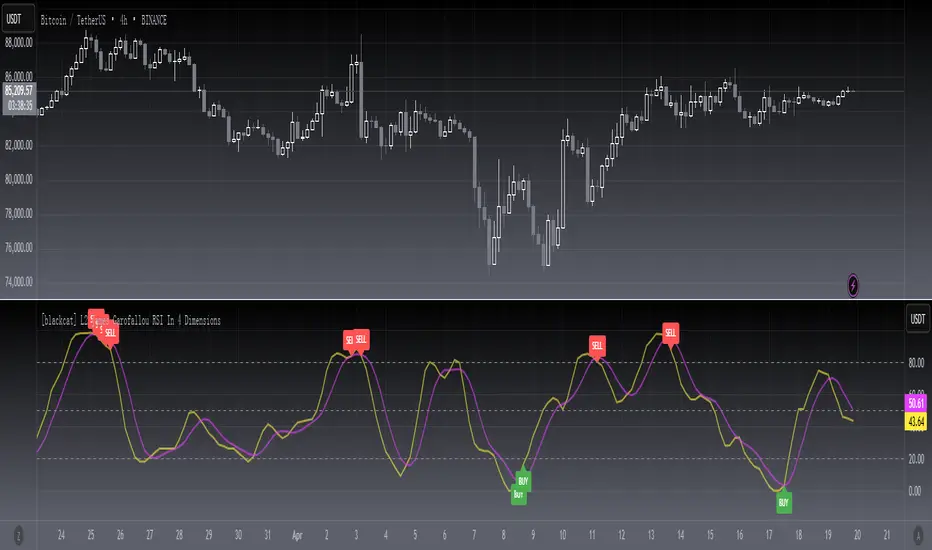
OVERVIEWThe [blackcat] L2 James Garofallou RSI In 4 Dimensions indicator is designed to provide a comprehensive analysis of market strength using multiple dimensions. This script calculates the Relative Strength Index (RSI) across various assets and timeframes, generating an oscillator that helps traders identify potential buying and selling opportunities 📊💡.
FEATURES
Calculates Relative Strength in 4 Dimensions based on EMA and SMA values.
Fetches security data from multiple exchanges for diverse market insights 🌐.
Plots two key lines:
RS4 Oscillator: Yellow line representing the calculated relative strength.
RS4 Signal: Fuchsia line as a smoothed version of the oscillator.
Adds horizontal reference lines at levels 20, 50, and 80 for easy visualization.
Generates visual labels for buy ('BUY') and sell ('SELL') signals:
"BUY" labeled in green when conditions are met below level 20.
"SELL" labeled in red when conditions are met above level 80.
Provides customizable inputs for period, resolution, repainting allowance, and signal source ⚙️.
HOW TO USE
Add the indicator to your TradingView chart by selecting it from the indicators list.
Observe the plotted RS4 Oscillator and RS4 Signal lines for trend direction and momentum.
Monitor the buy ('BUY') and sell ('SELL') labels on the chart for potential trade opportunities.
Use the horizontal reference lines (20, 50, 80) to gauge overbought or oversold conditions.
Set up alerts based on the generated signals to receive notifications when conditions are met 📲.
INPUT PARAMETERS
Periods: Define the smoothing period for calculations (default is 10).
Resolution: Select the desired timeframe for fetching security data.
Allow Repainting?: Choose whether to allow repainting of historical bars.
Signal Source: Select the price source for calculating relative strength (default is close).
LIMITATIONS
The indicator relies heavily on multiple asset comparisons, which might not be suitable for all trading styles.
False signals can occur in highly volatile or ranging markets 🌪️.
Users should always confirm signals with other forms of analysis before making decisions.
NOTES
Ensure that you have sufficient historical data available for accurate calculations.
Test the indicator thoroughly on demo accounts before applying it to live trading 🔍.
Adjust input parameters to suit different market conditions and personal preferences.
Skrip sumber terbuka
Dalam semangat TradingView sebenar, pencipta skrip ini telah menjadikannya sumber terbuka, jadi pedagang boleh menilai dan mengesahkan kefungsiannya. Terima kasih kepada penulis! Walaupuan anda boleh menggunakan secara percuma, ingat bahawa penerbitan semula kod ini tertakluk kepada Peraturan Dalaman.
Avoid losing contact!Don't miss out! The first and most important thing to do is to join my Discord chat now! Click here to start your adventure: discord.com/invite/ZTGpQJq 防止失联,请立即行动,加入本猫聊天群: discord.com/invite/ZTGpQJq
Penafian
Maklumat dan penerbitan adalah tidak bertujuan, dan tidak membentuk, nasihat atau cadangan kewangan, pelaburan, dagangan atau jenis lain yang diberikan atau disahkan oleh TradingView. Baca lebih dalam Terma Penggunaan.